
Advanced Observability for Production Systems
A practical guide for SREs, DevOps, Platform, Cloud, and AI Engineers.

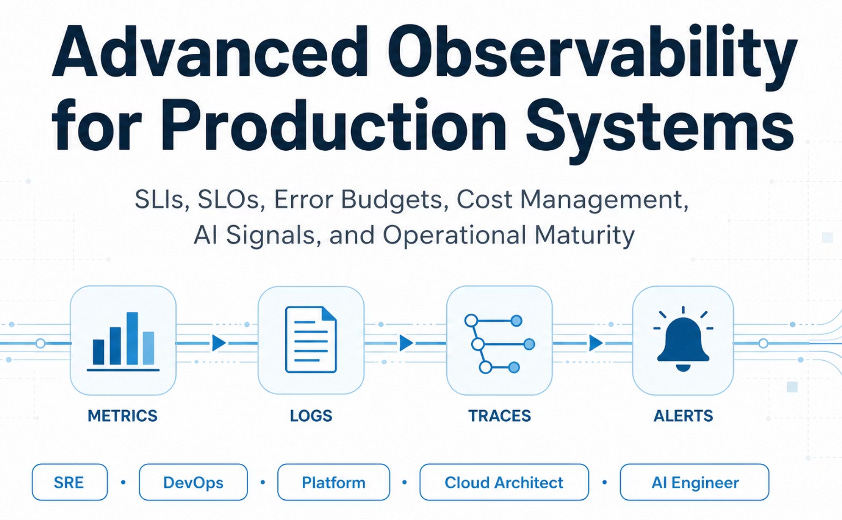
Most teams have dashboards. Few have observability. The difference is intent — knowing what to measure, what it costs, who owns it, and what happens when an alert fires. This post (with the visual guide attached) covers the full picture.
1. SLI, SLO, SLA & Error Budgets — Start Here
SLI = measurable signal of service behavior (availability, latency, error rate, freshness)
SLO = target on that SLI (e.g., 99.9% availability)
SLA = external commitment to customers — breach has consequences
Error Budget = 100% minus SLO (0.1% ≈ ~43 min/month)
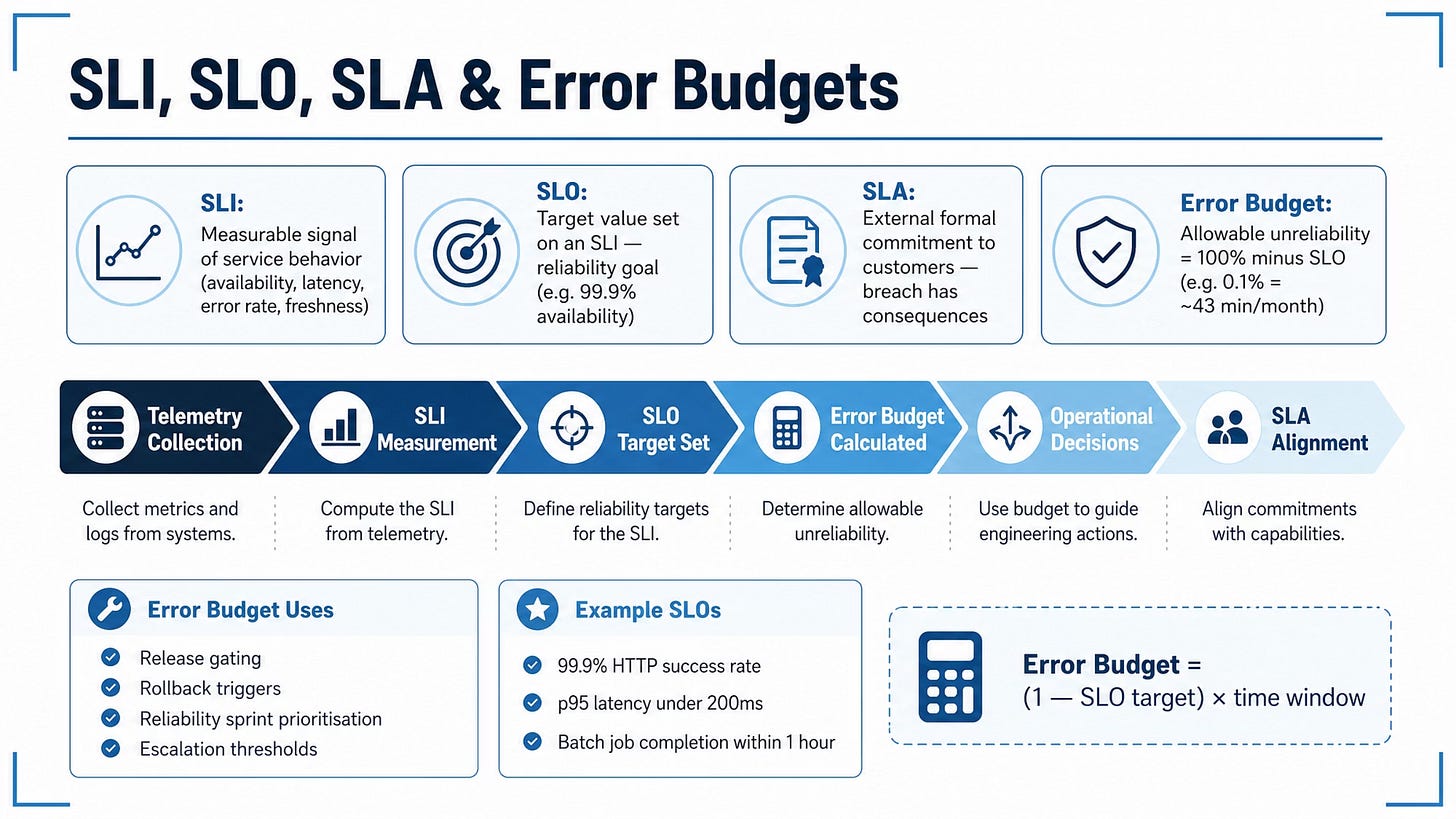
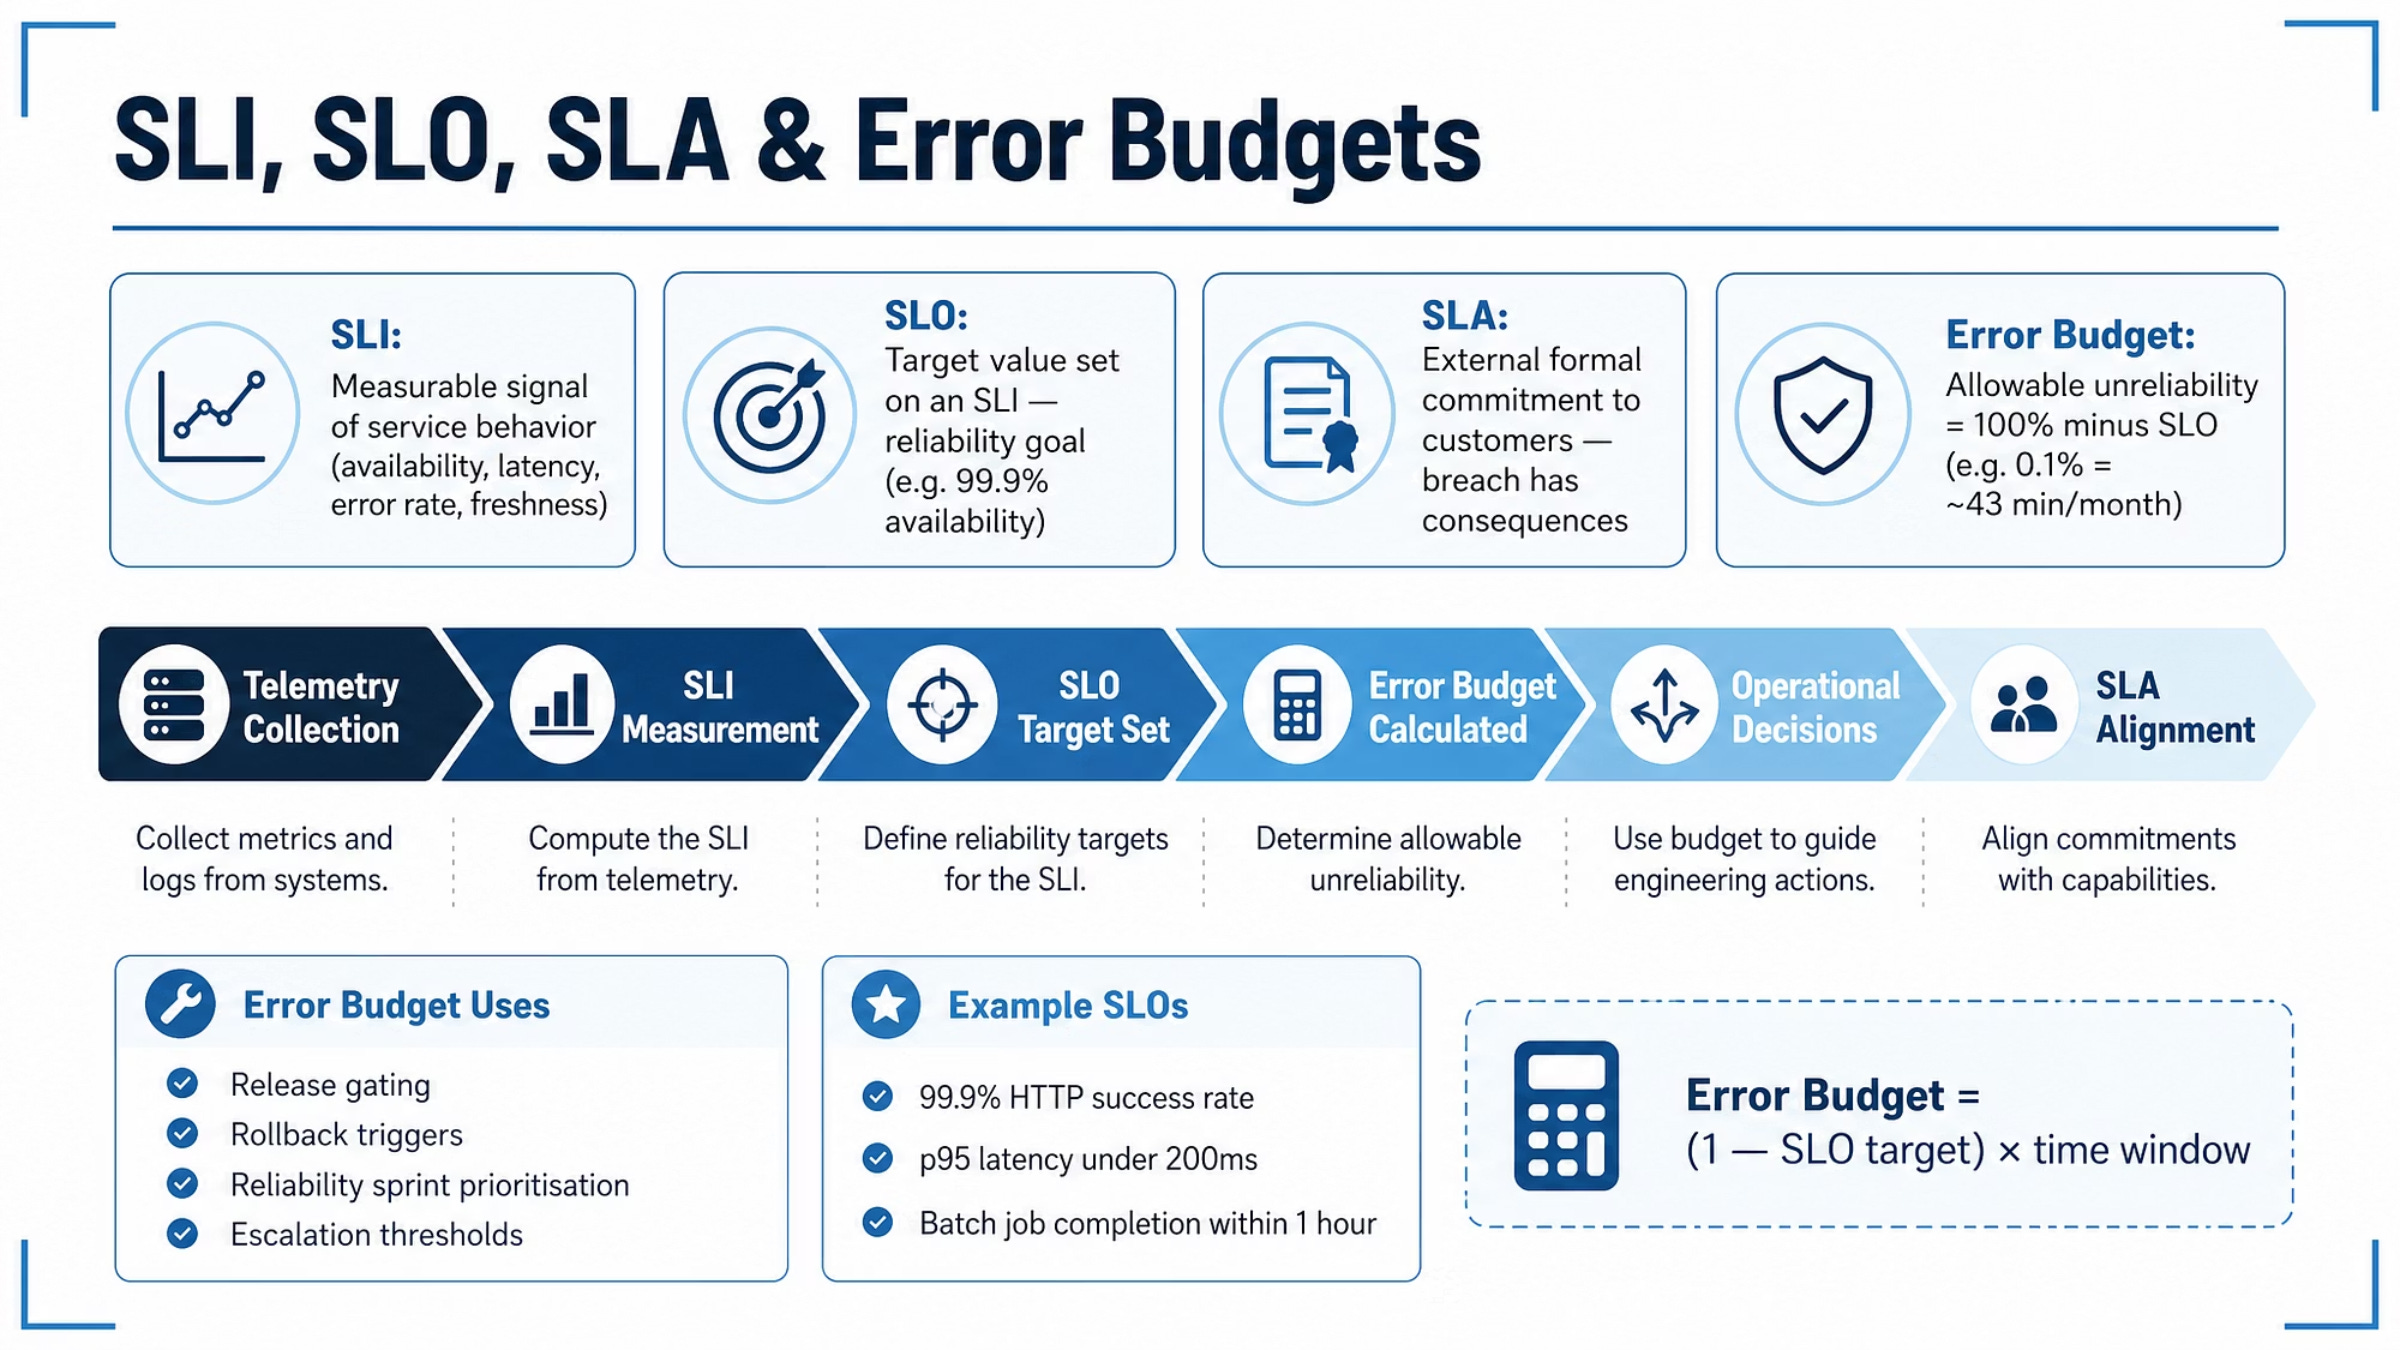
The flow: collect telemetry → measure SLI → set SLO → calculate error budget → use it to drive release gating, rollback triggers, reliability sprints, and escalation thresholds.
Error Budget = (1 − SLO target) × time window
2. Observability Cost Management - Telemetry Isn’t Free
Cost drivers: ingestion volume, storage retention, indexing, query execution, cardinality, and duplication. The biggest hotspots: noisy debug logs, always-on full tracing, and high-cardinality labels.
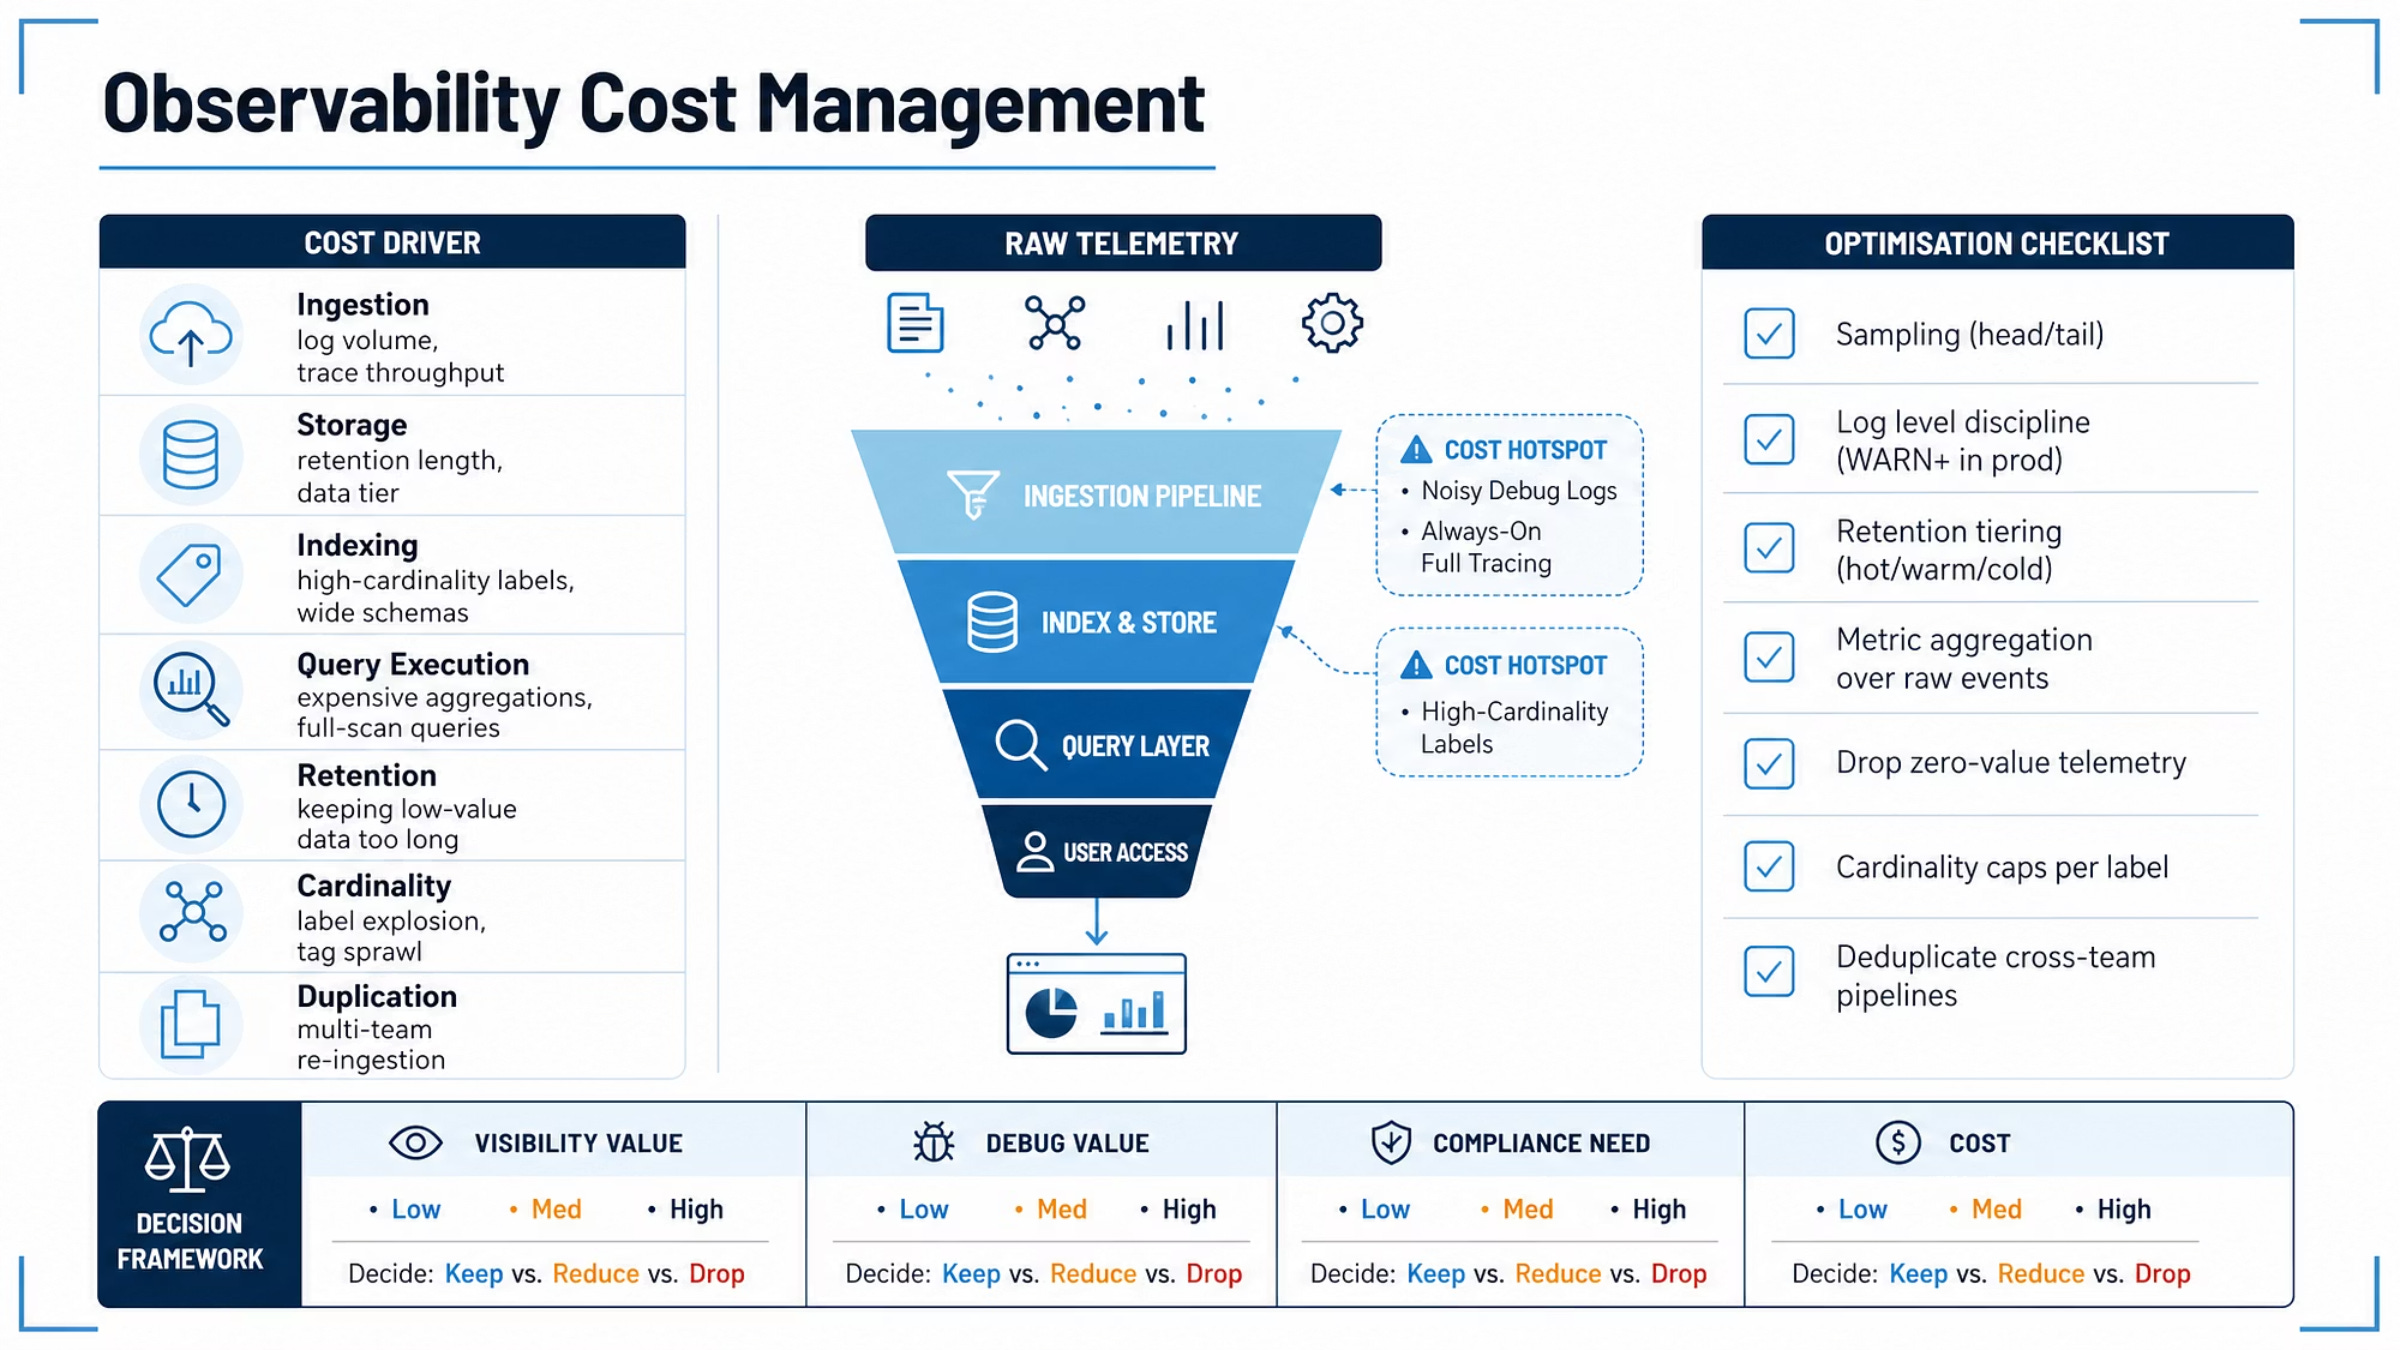
The optimisation checklist:
Sampling (head/tail)
Log level discipline (WARN+ in prod)
Retention tiering (hot/warm/cold)
Metric aggregation over raw events
Drop zero-value telemetry, cap cardinality, deduplicate cross-team pipelines
For every signal, decide Keep vs. Reduce vs. Drop based on visibility value, debug value, compliance need, and cost.
3. Security & Access Control — Your Logs Contain PII
Telemetry leaks customer IDs, auth tokens, internal topology, payload fragments, and IPs. Secure every layer: encrypt in transit, filter PII at the collector, encrypt at rest, enforce RBAC and team-scoped views, and audit all access.
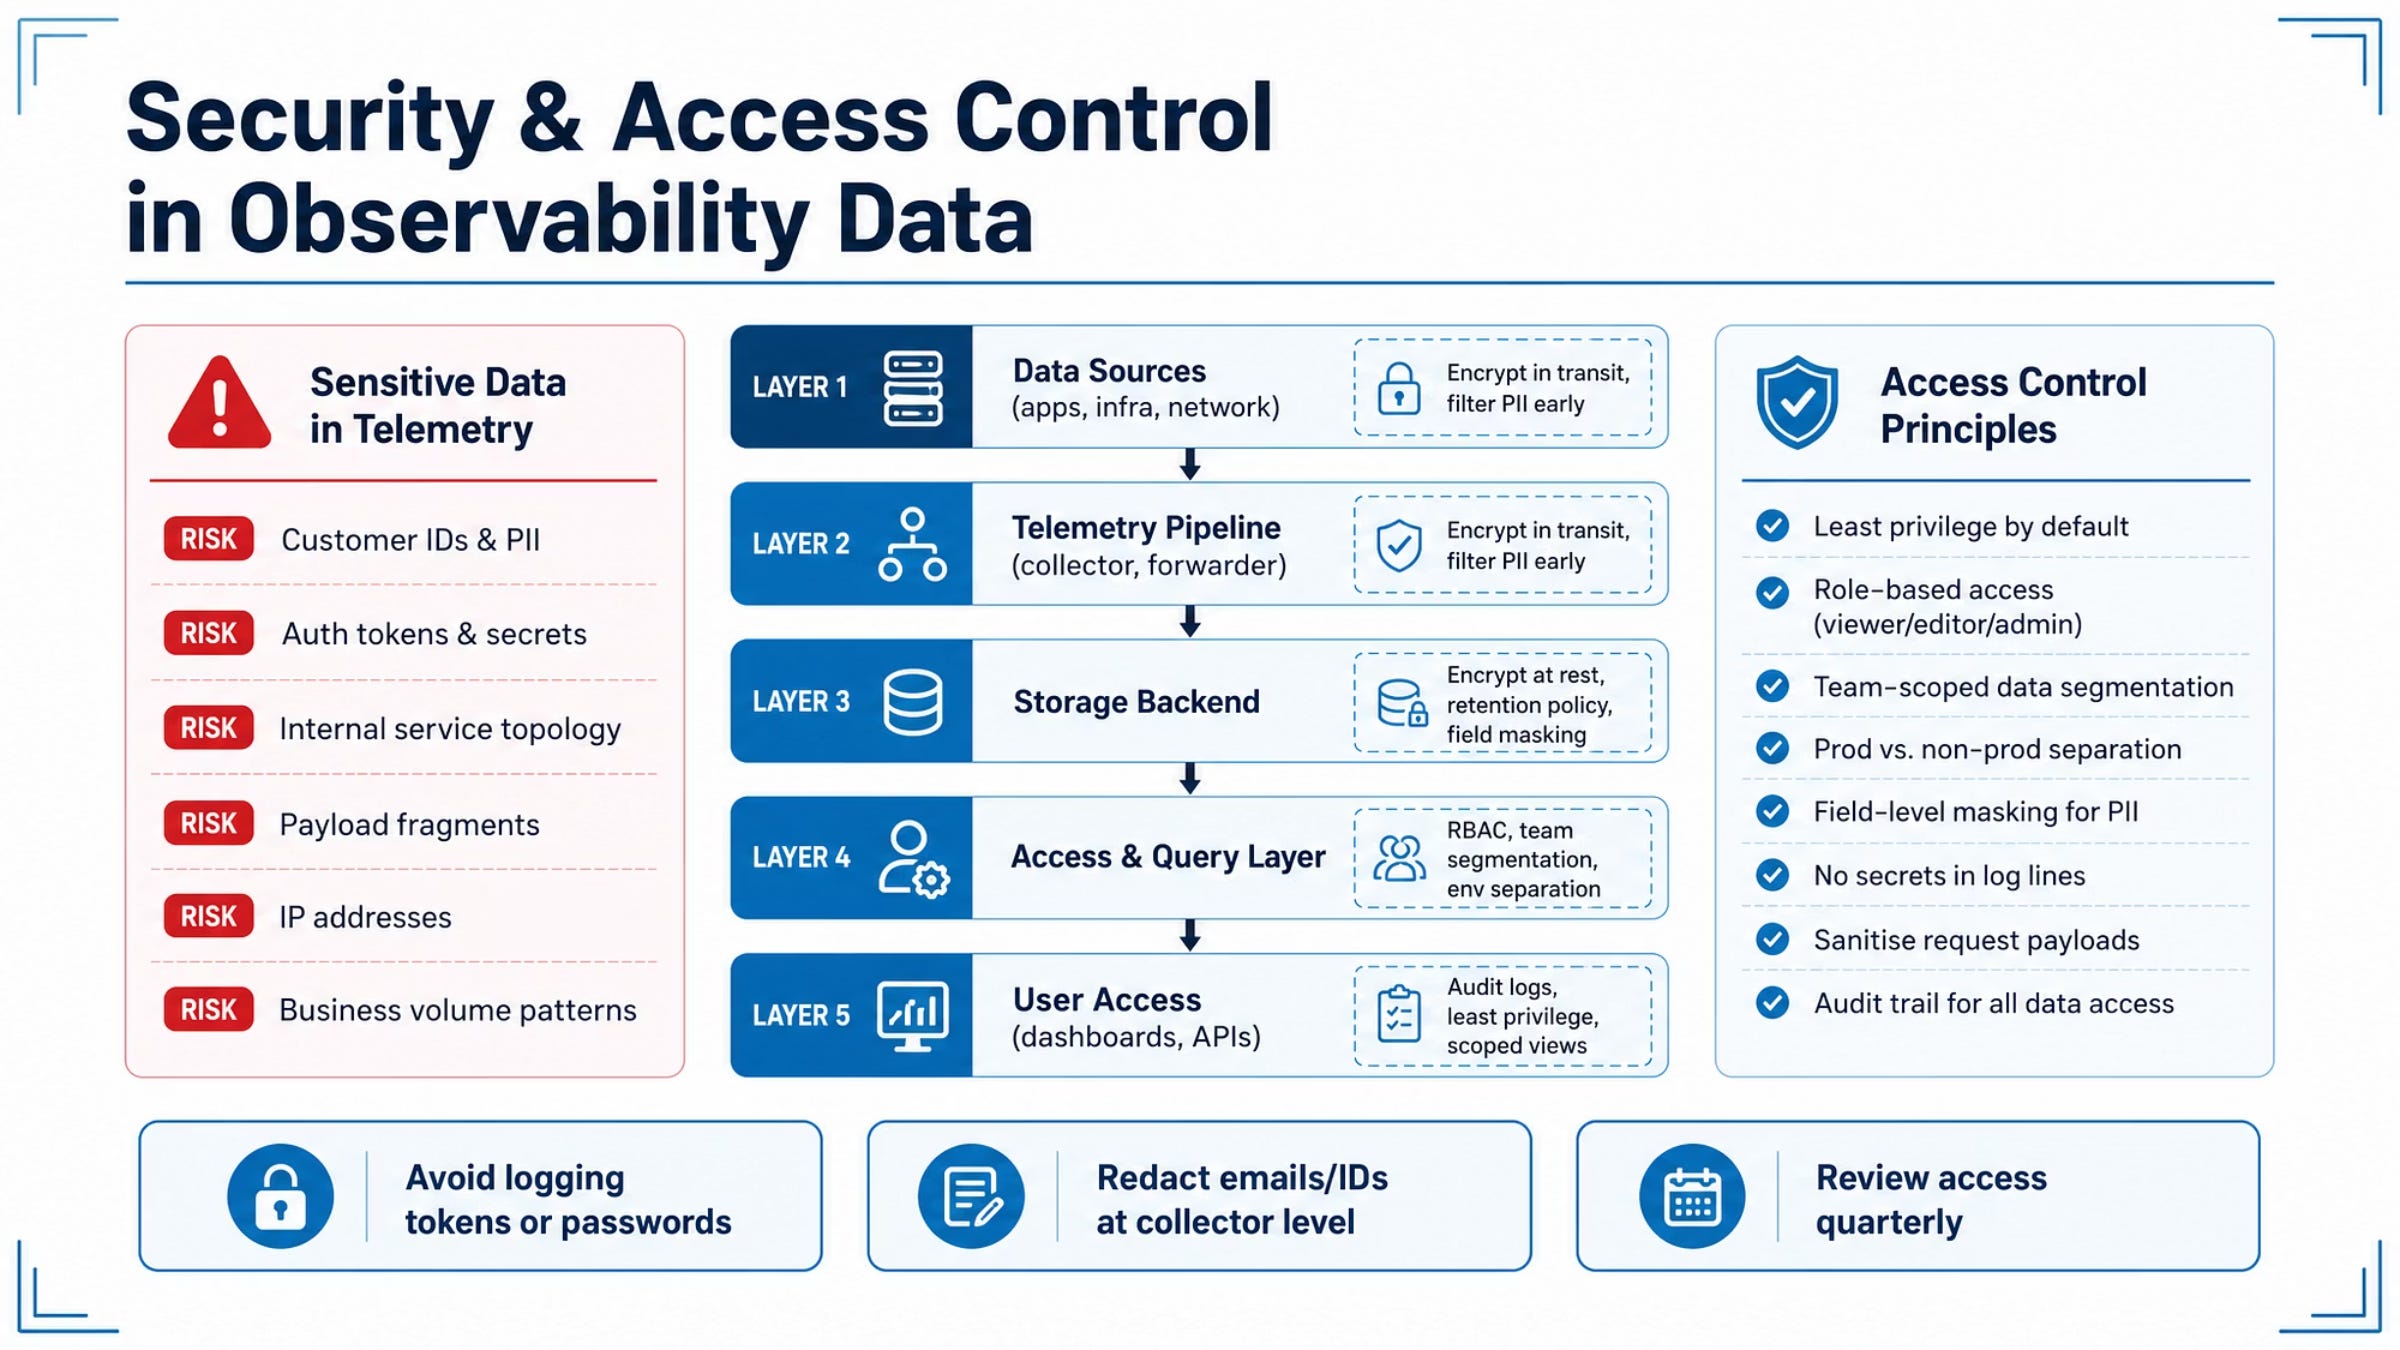
Three habits: never log tokens/passwords, redact emails/IDs at collector level, review access quarterly.
4. Developer Self-Service Observability
Maturity runs from “ops gate-keeps everything” to fully self-service: golden templates, auto-instrumentation, internal portal. Good self-service means devs can deploy, see auto-populated dashboards, get the alert, and investigate directly — no SRE ticket needed.
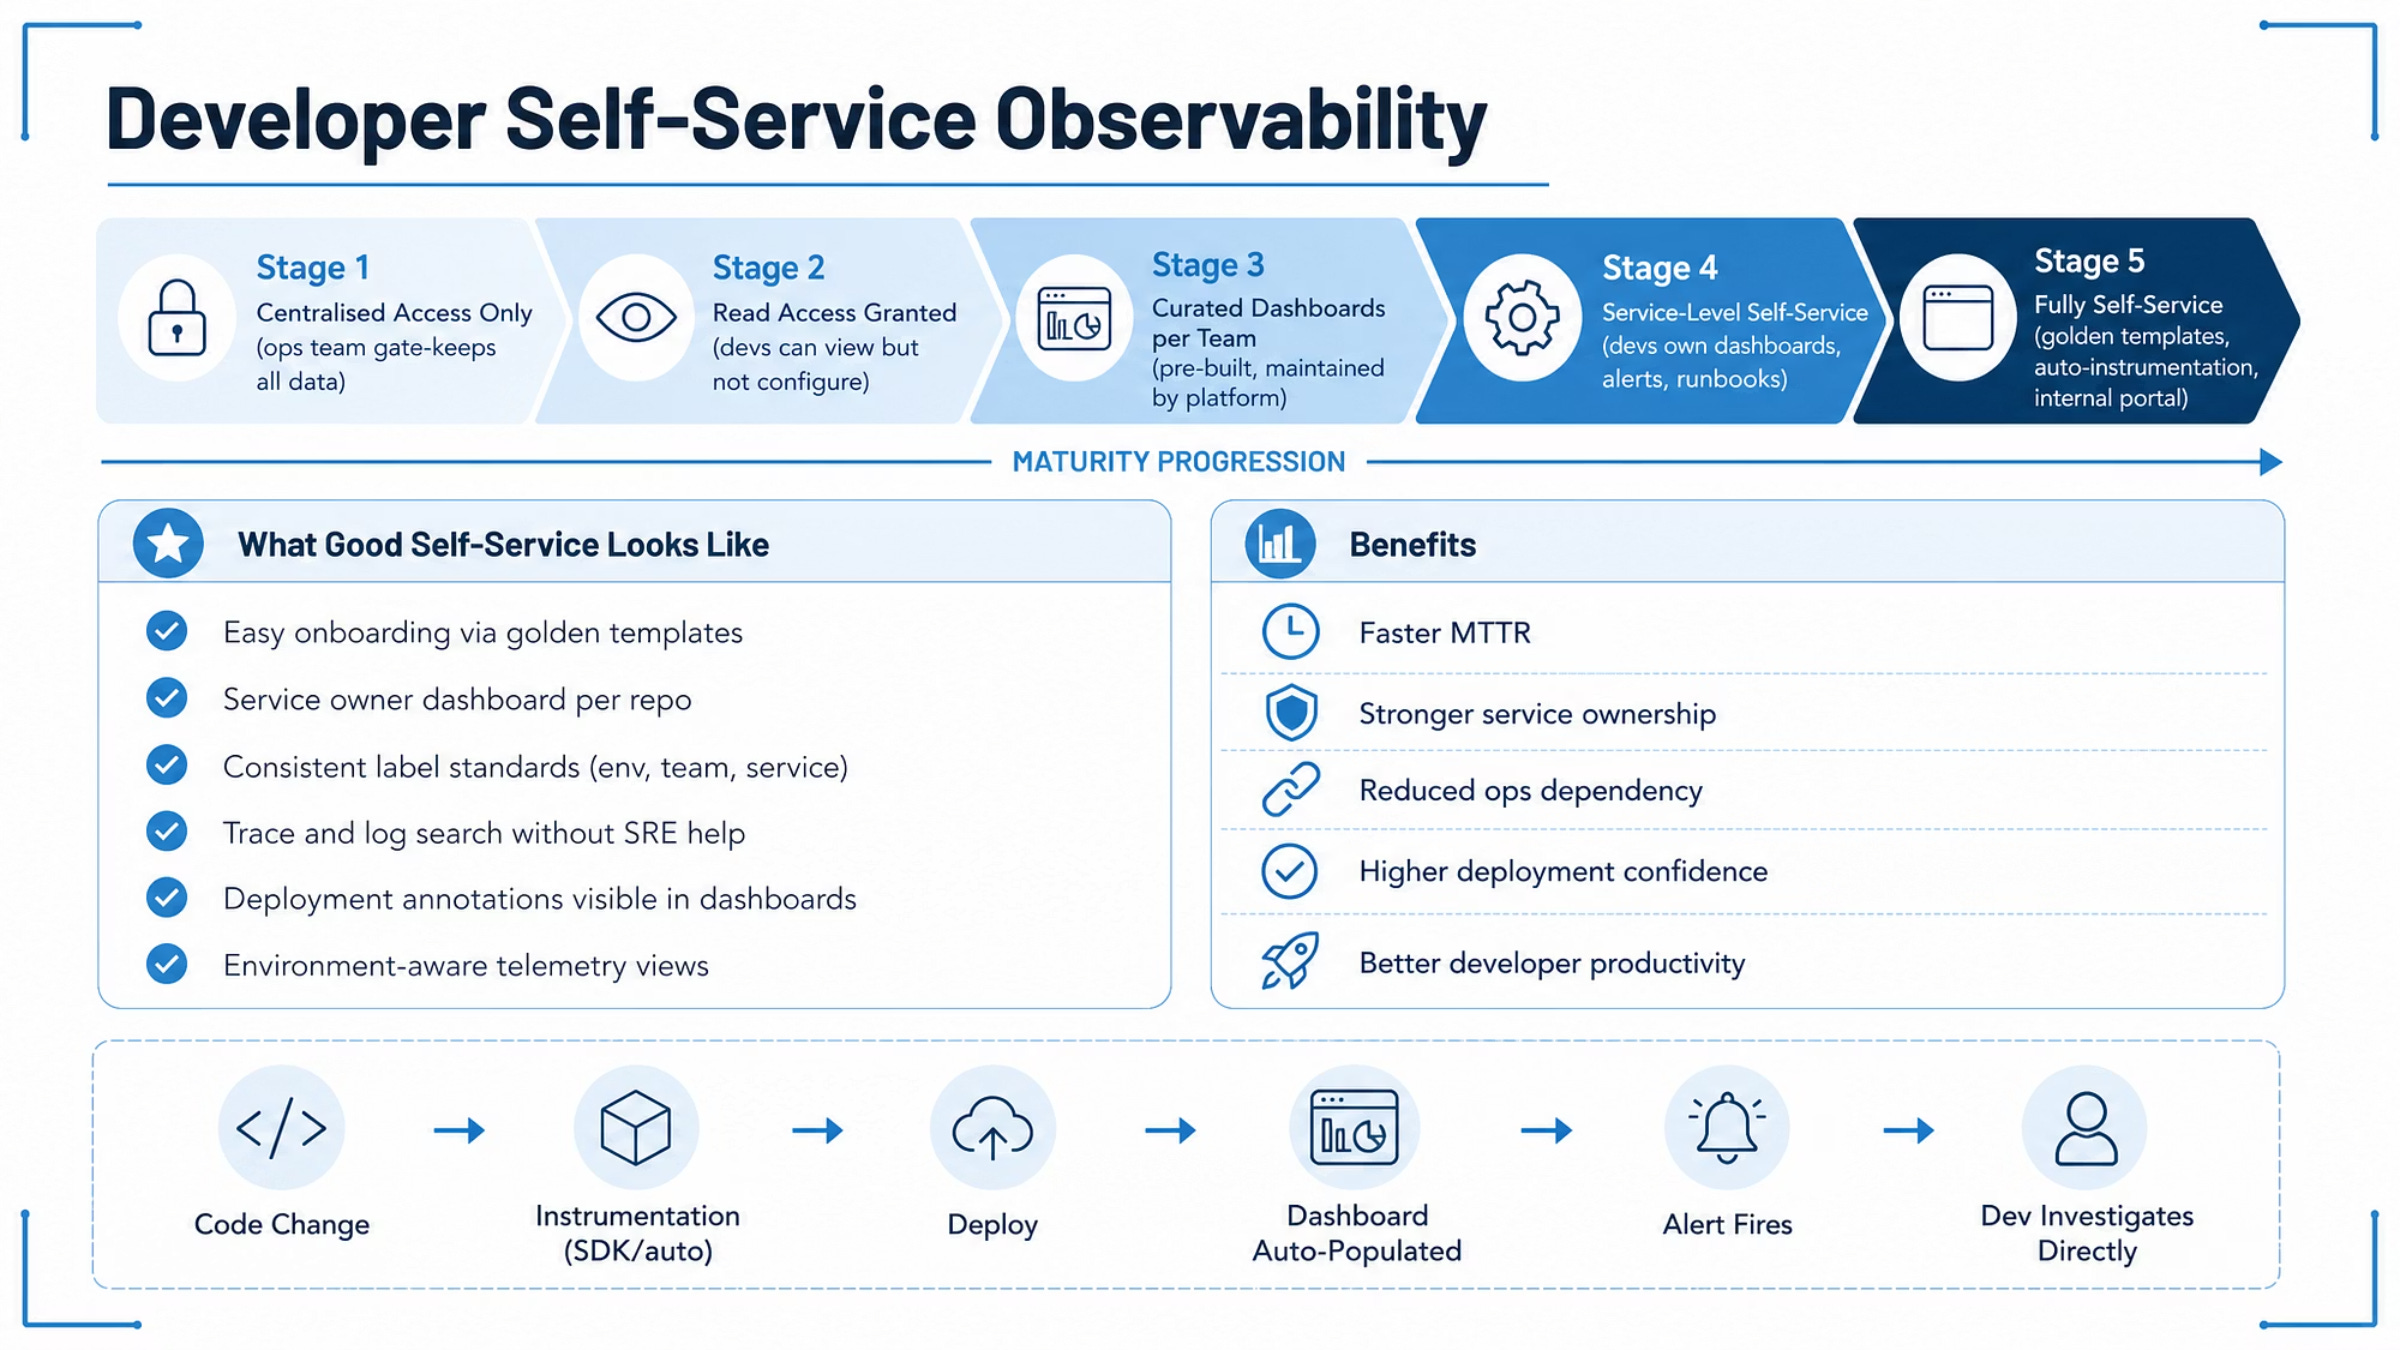
Result: faster MTTR, stronger ownership, less ops dependency.
5. AI for Observability & Anomaly Detection
AI shines at anomaly detection, log clustering, alert priority scoring, incident summarisation, change correlation, and root-cause suggestions. But know the limits false positives, opaque decisions, training drift, and overreliance risk.
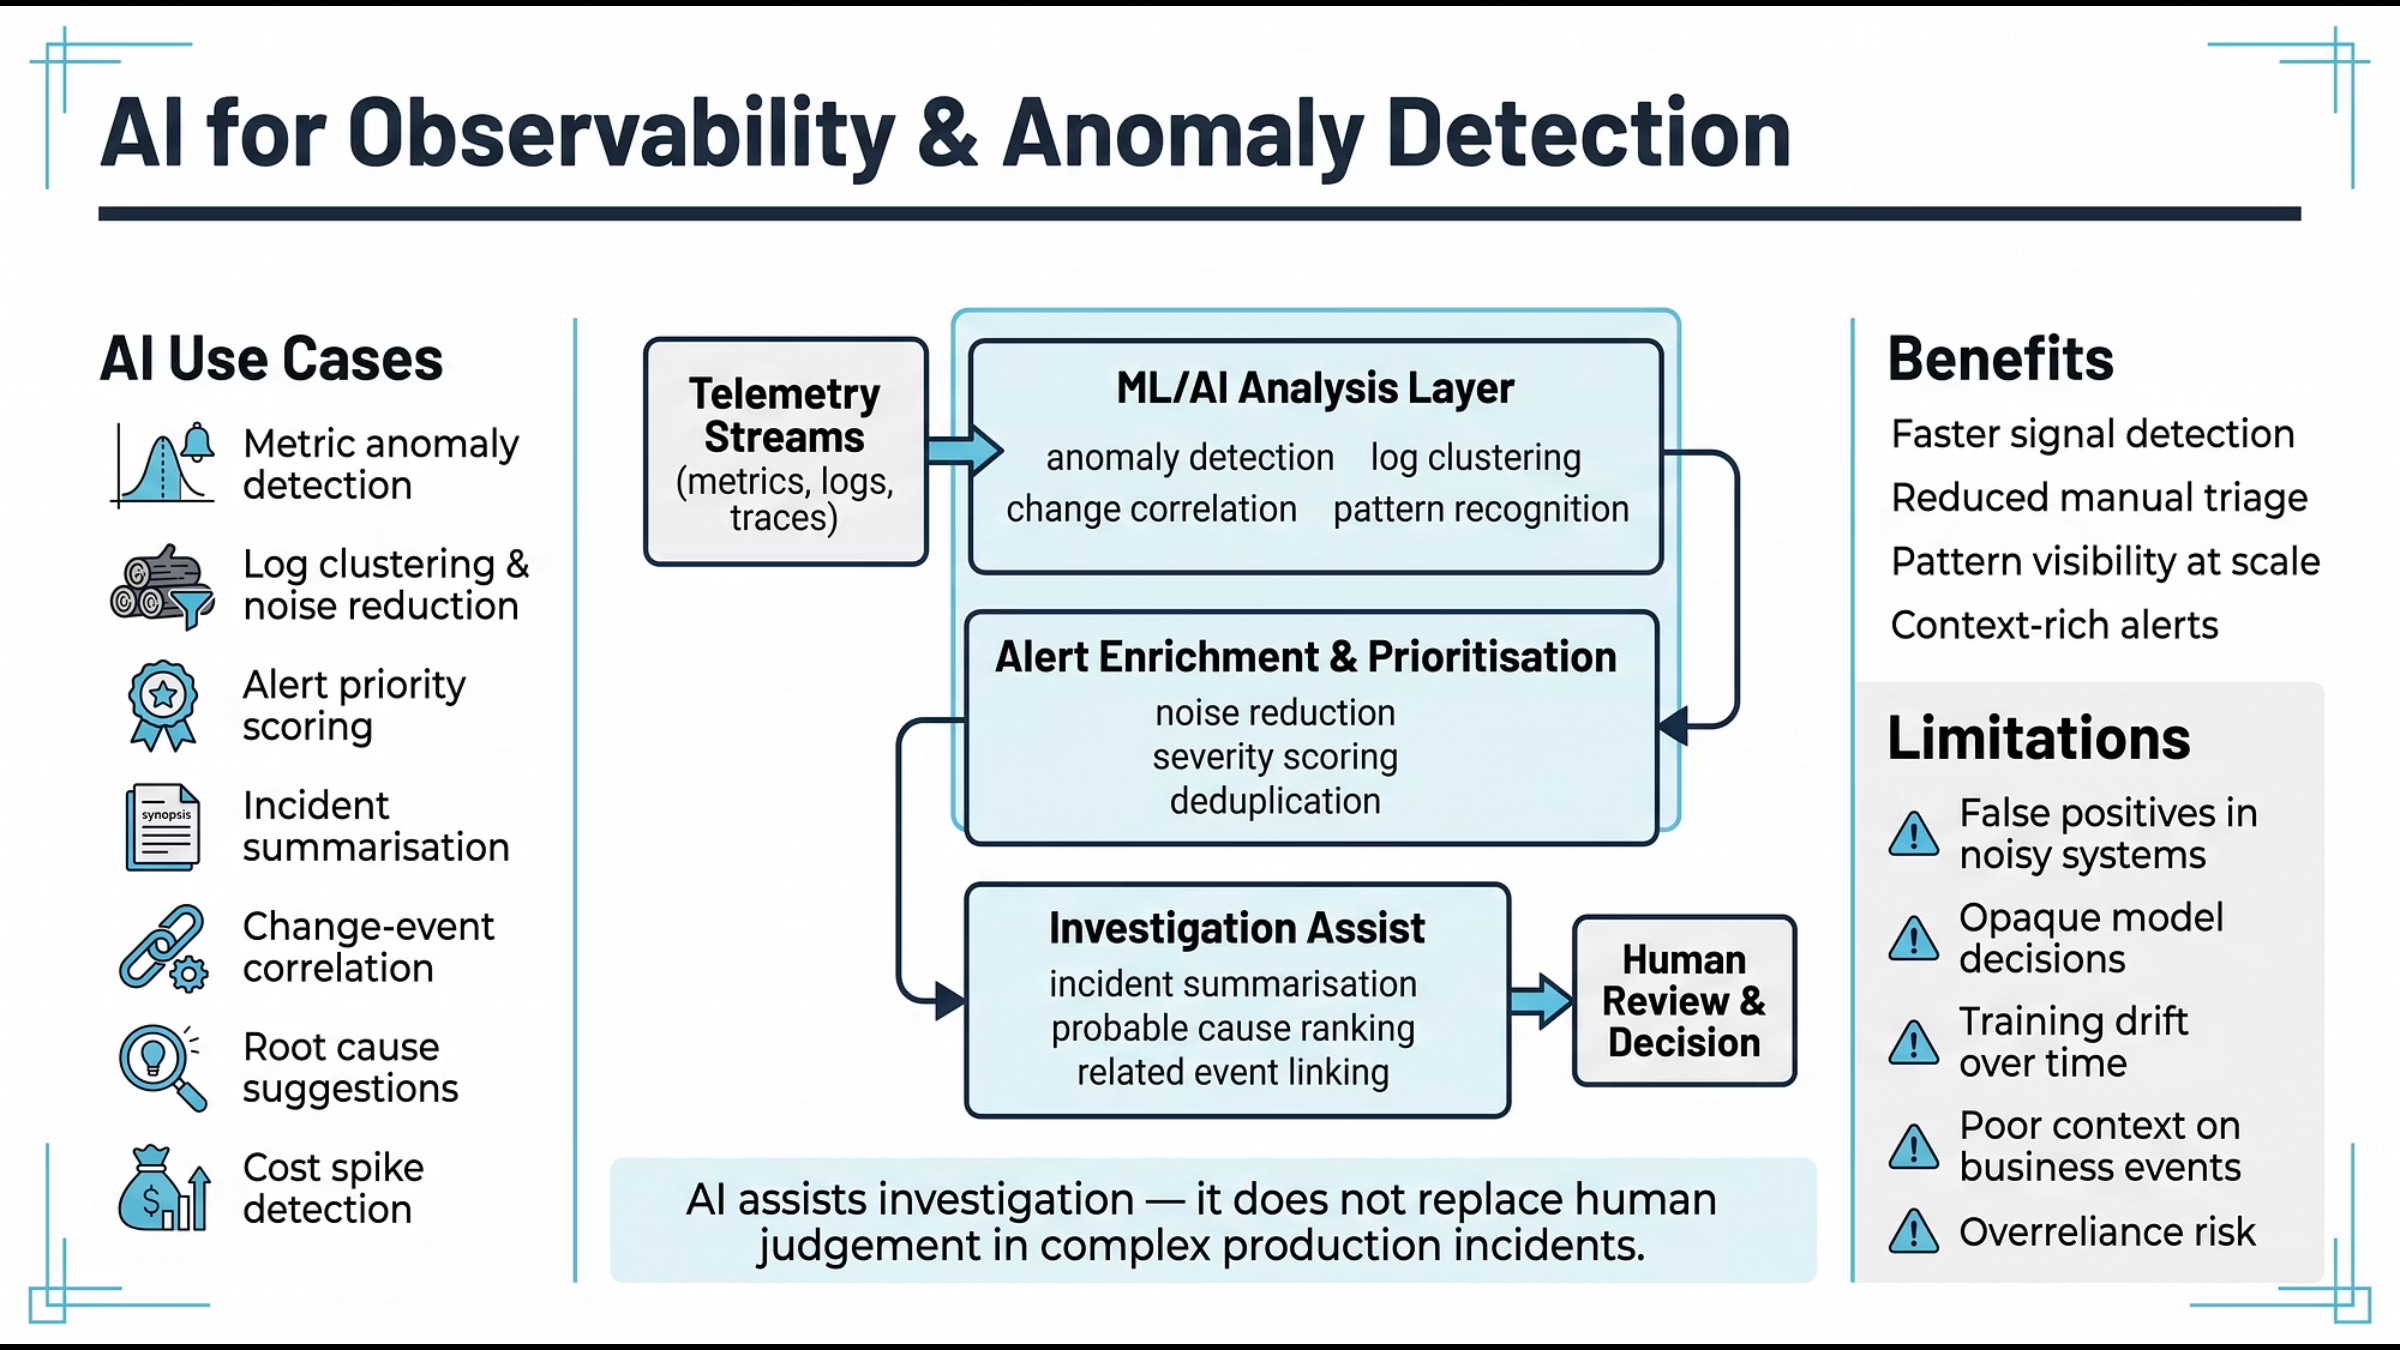
AI assists investigation - it does not replace human judgement in complex production incidents.
6. Observability Anti-Patterns That Cost You
The twelve killers: collect everything, dashboard sprawl, vanity metrics, no signal ownership, weak instrumentation, poor label discipline, no trace correlation, logging sensitive data, noisy alerts, single-signal reliance, no post-incident learning, and treating tooling as observability.
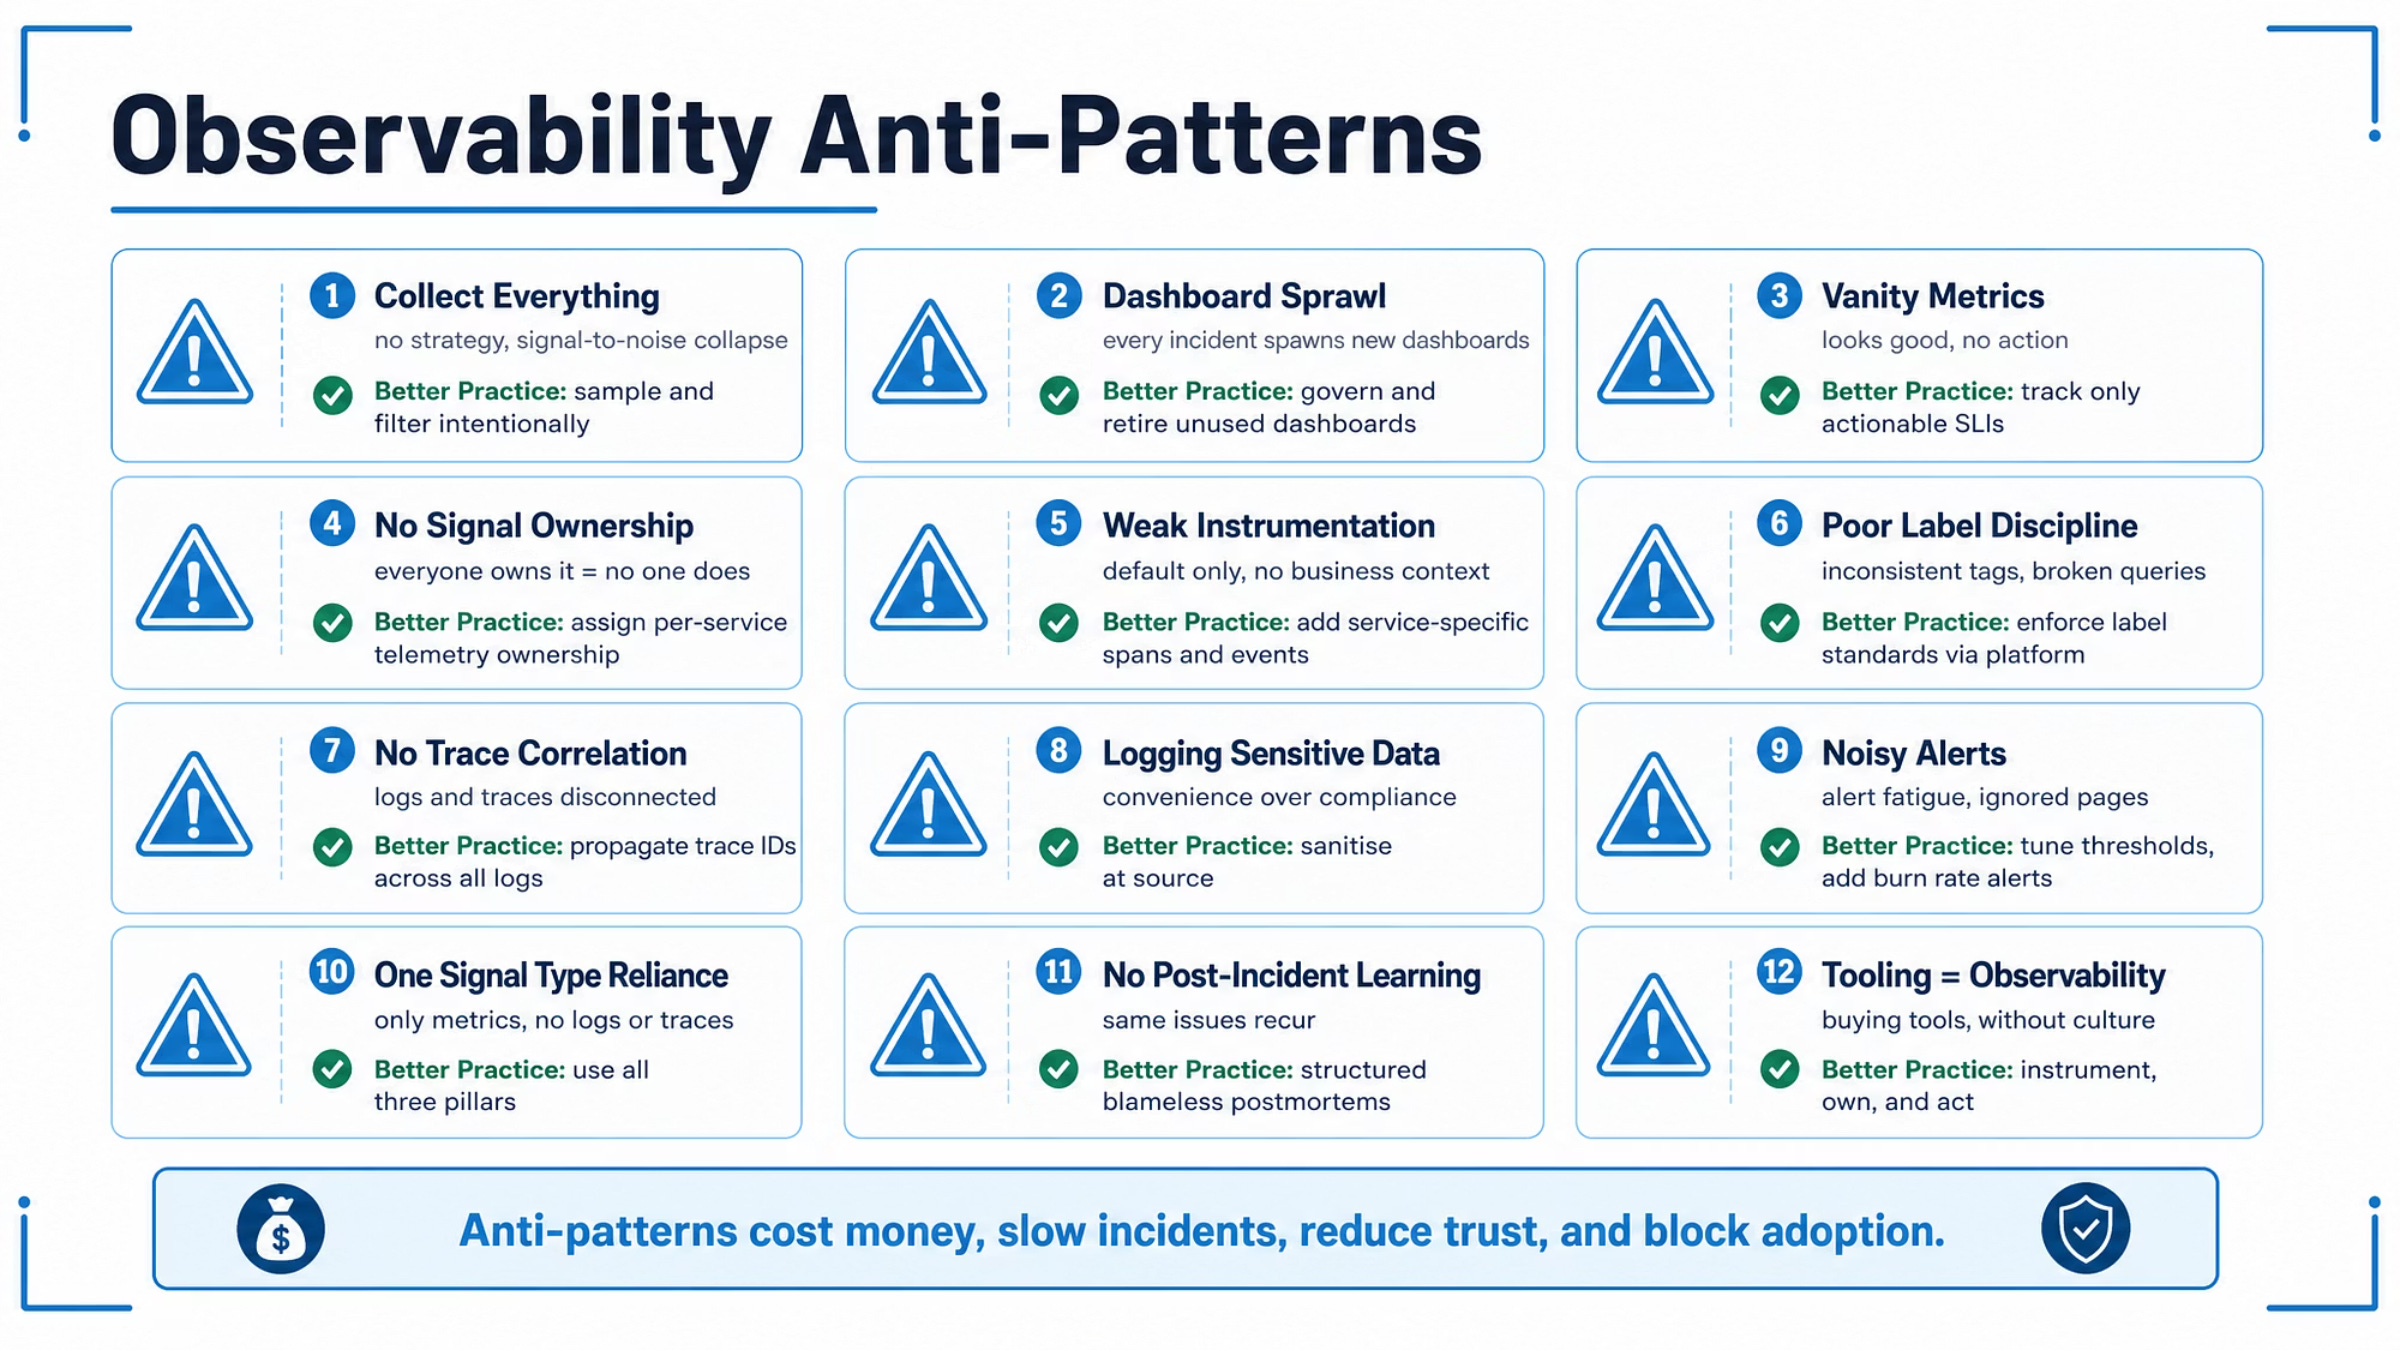
Anti-patterns cost money, slow incidents, reduce trust, and block adoption.
7. Team Ownership & Culture
Four models: centralised SRE, embedded ownership, platform-enabled self-service, and hybrid. Whatever the model, the reinforcement loop matters: devs own signals → better telemetry → faster triage → postmortem learning → better instrumentation.
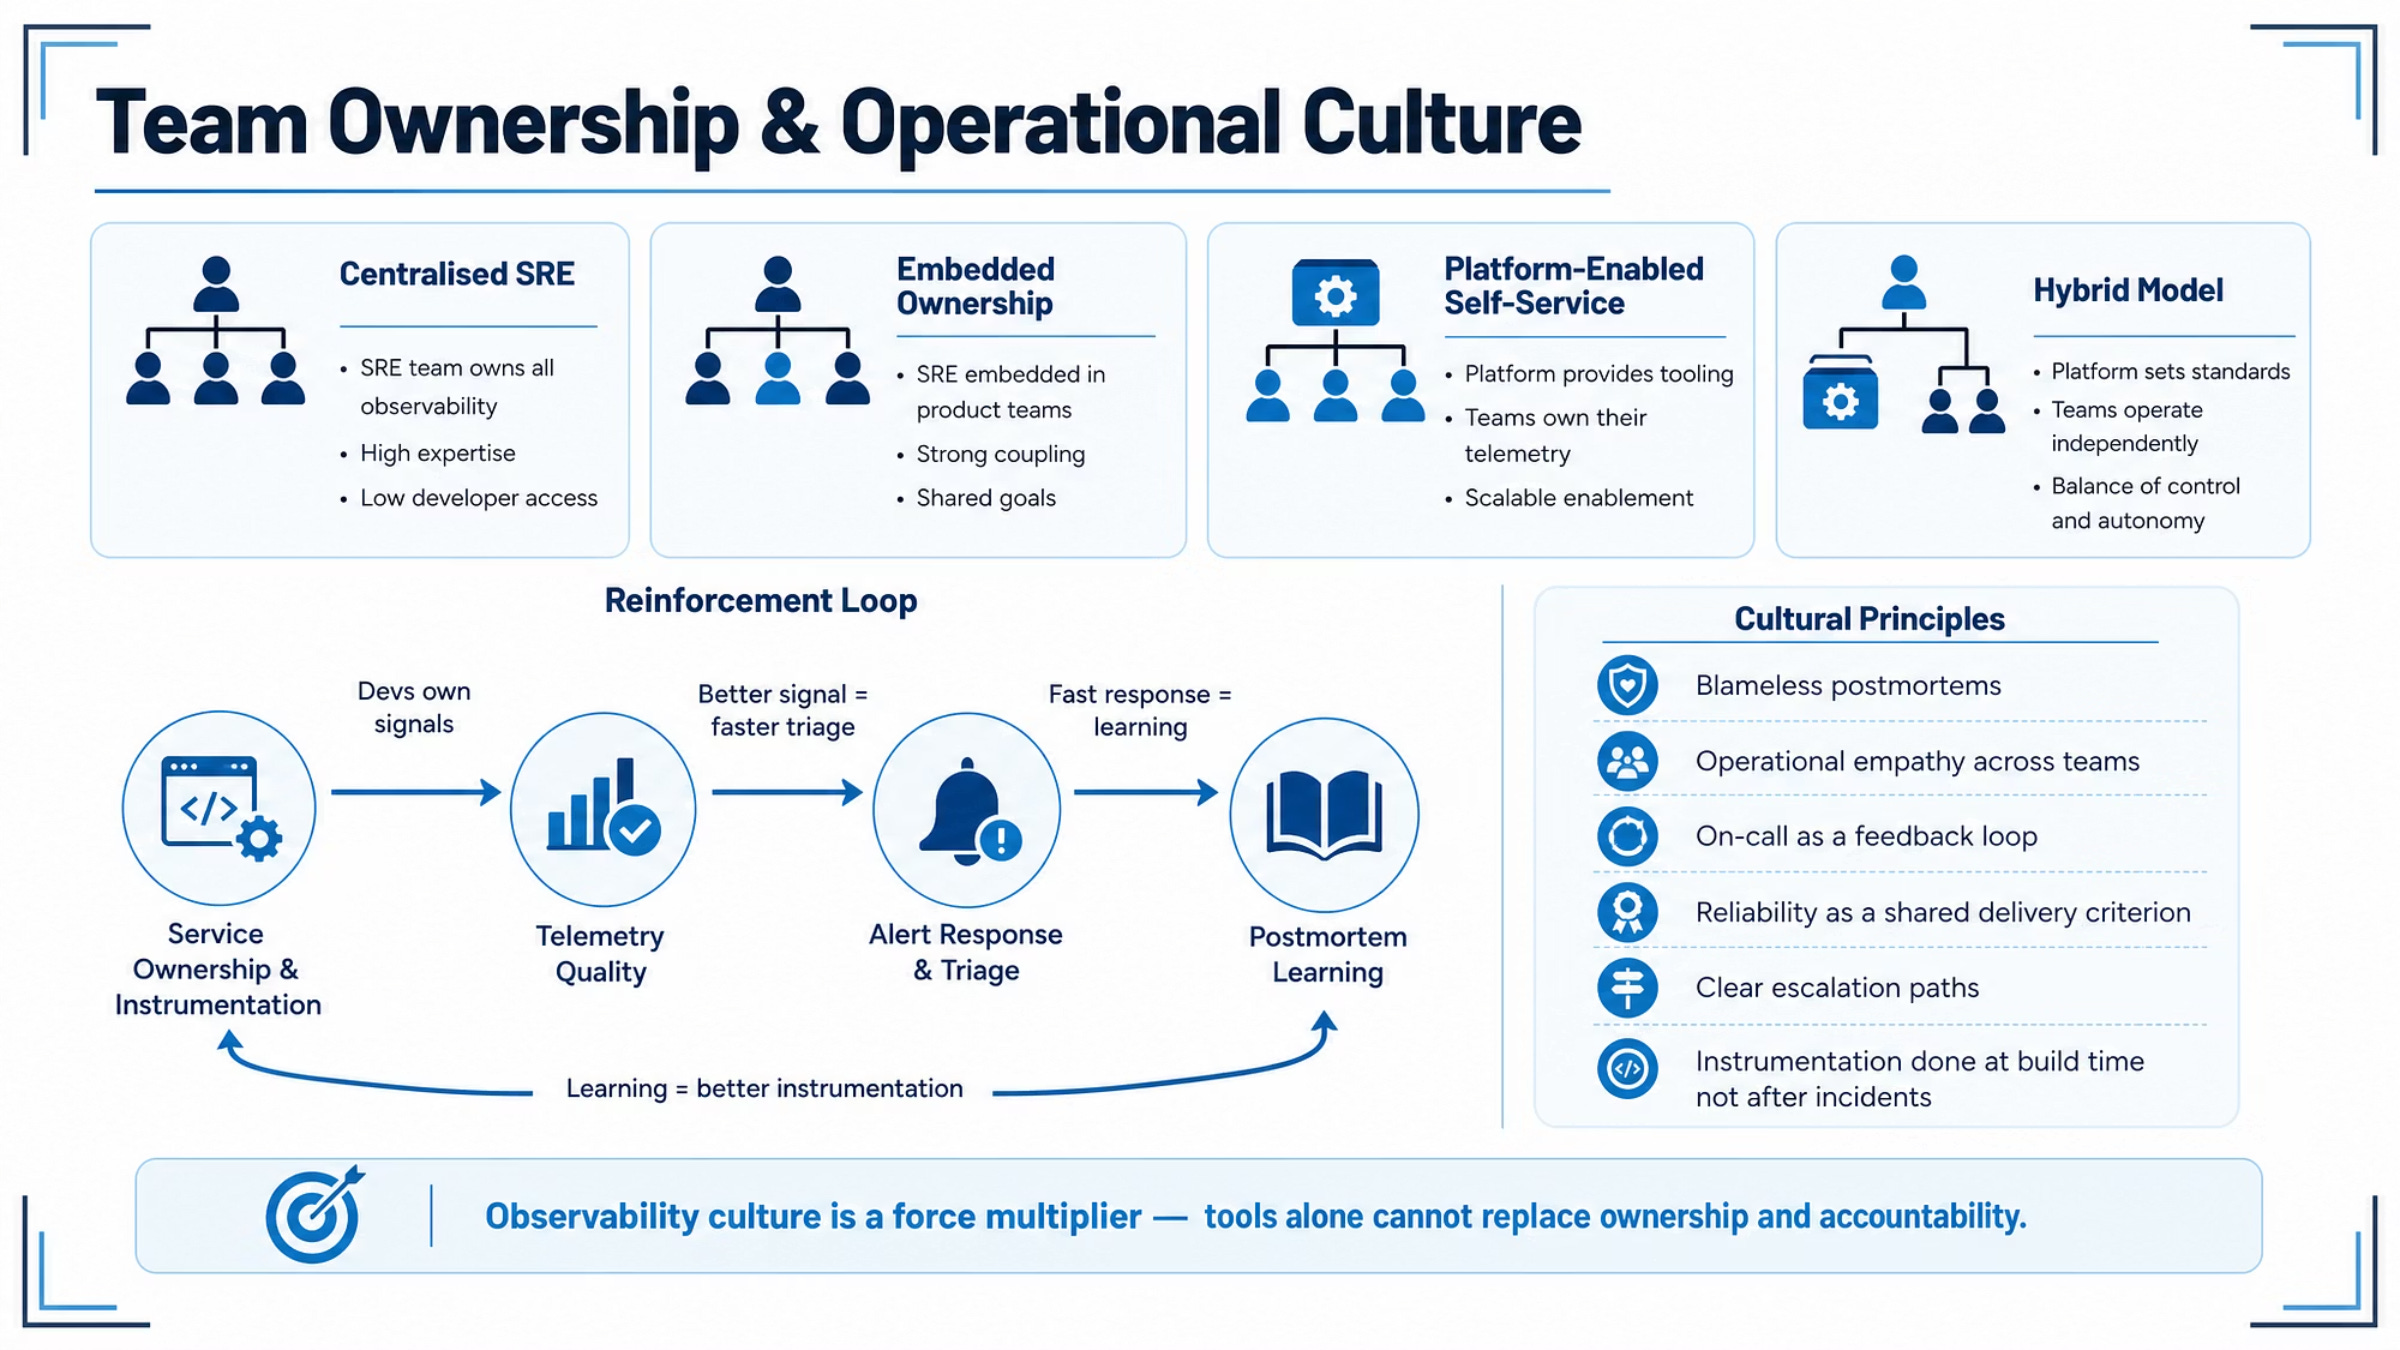
Observability culture is a force multiplier — tools alone cannot replace ownership and accountability.
8. Runbooks & Operational Readiness
Every alert needs a runbook: context, symptoms, likely causes, investigation steps, mitigation, rollback, and escalation. Review quarterly, test rollbacks, run gamedays.
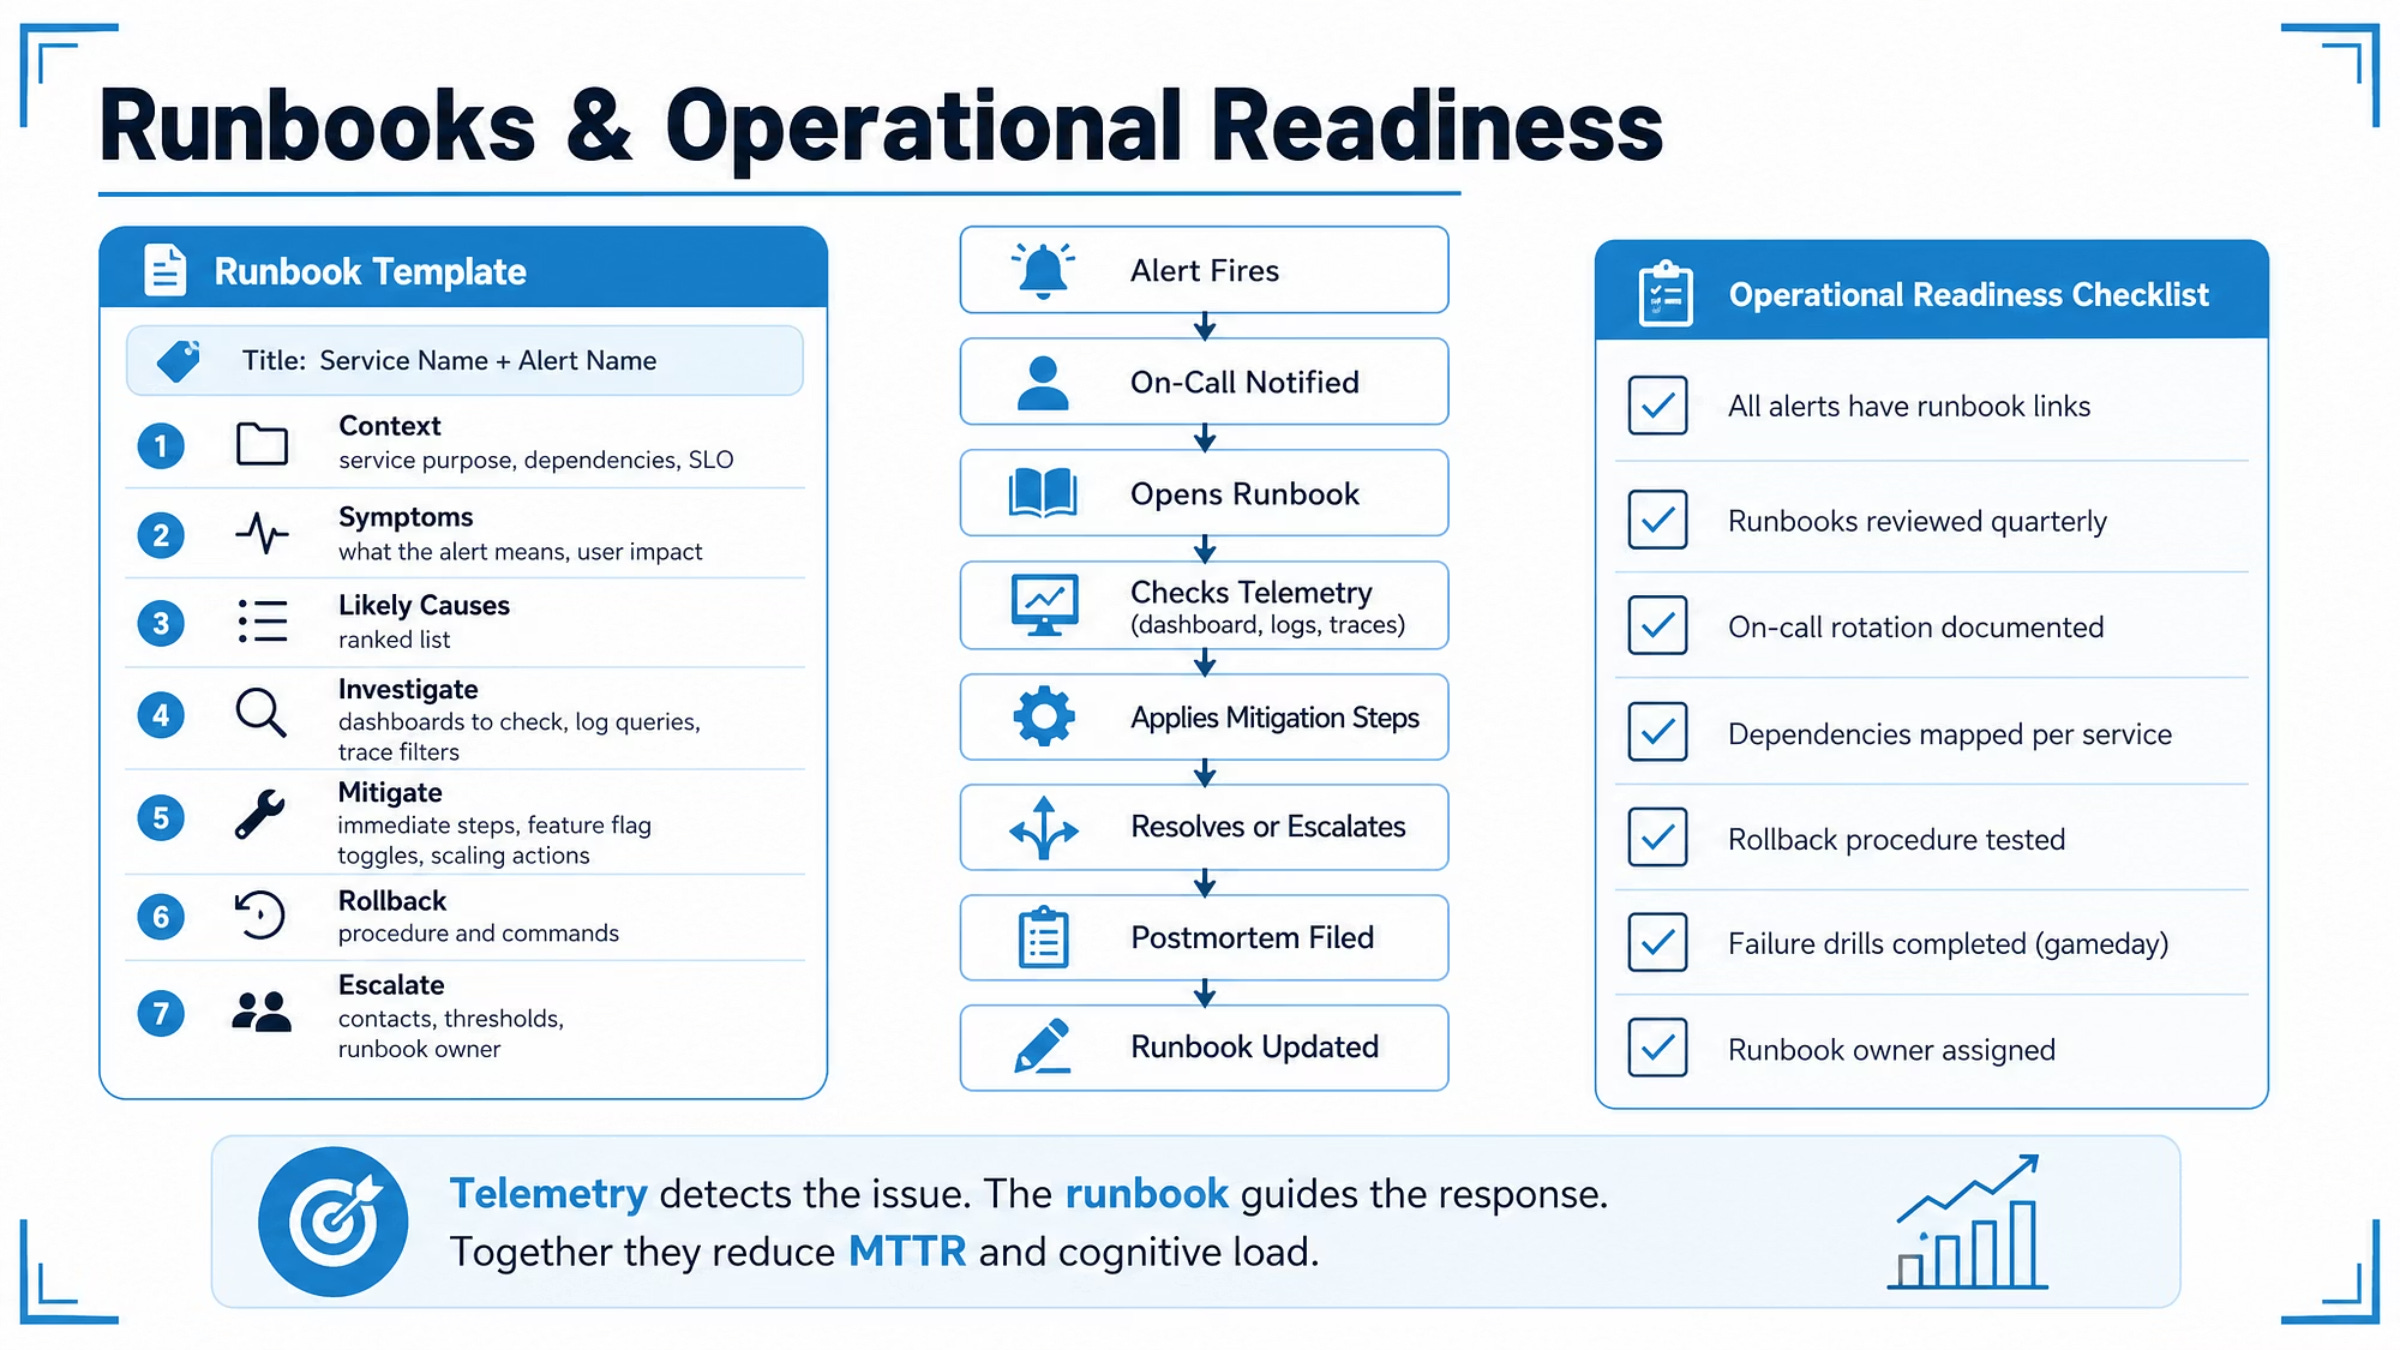
Telemetry detects the issue. The runbook guides the response. Together they reduce MTTR and cognitive load.
9. Observability for AI & LLM Apps
LLM apps need new signals: prompt/model versions, token usage, response quality, hallucination indicators, tool-call success, retrieval relevance, guardrail triggers, and cost per request. Watch for failure modes like bad retrieval, prompt regression, latency spikes, and cost explosions from unbounded token loops.
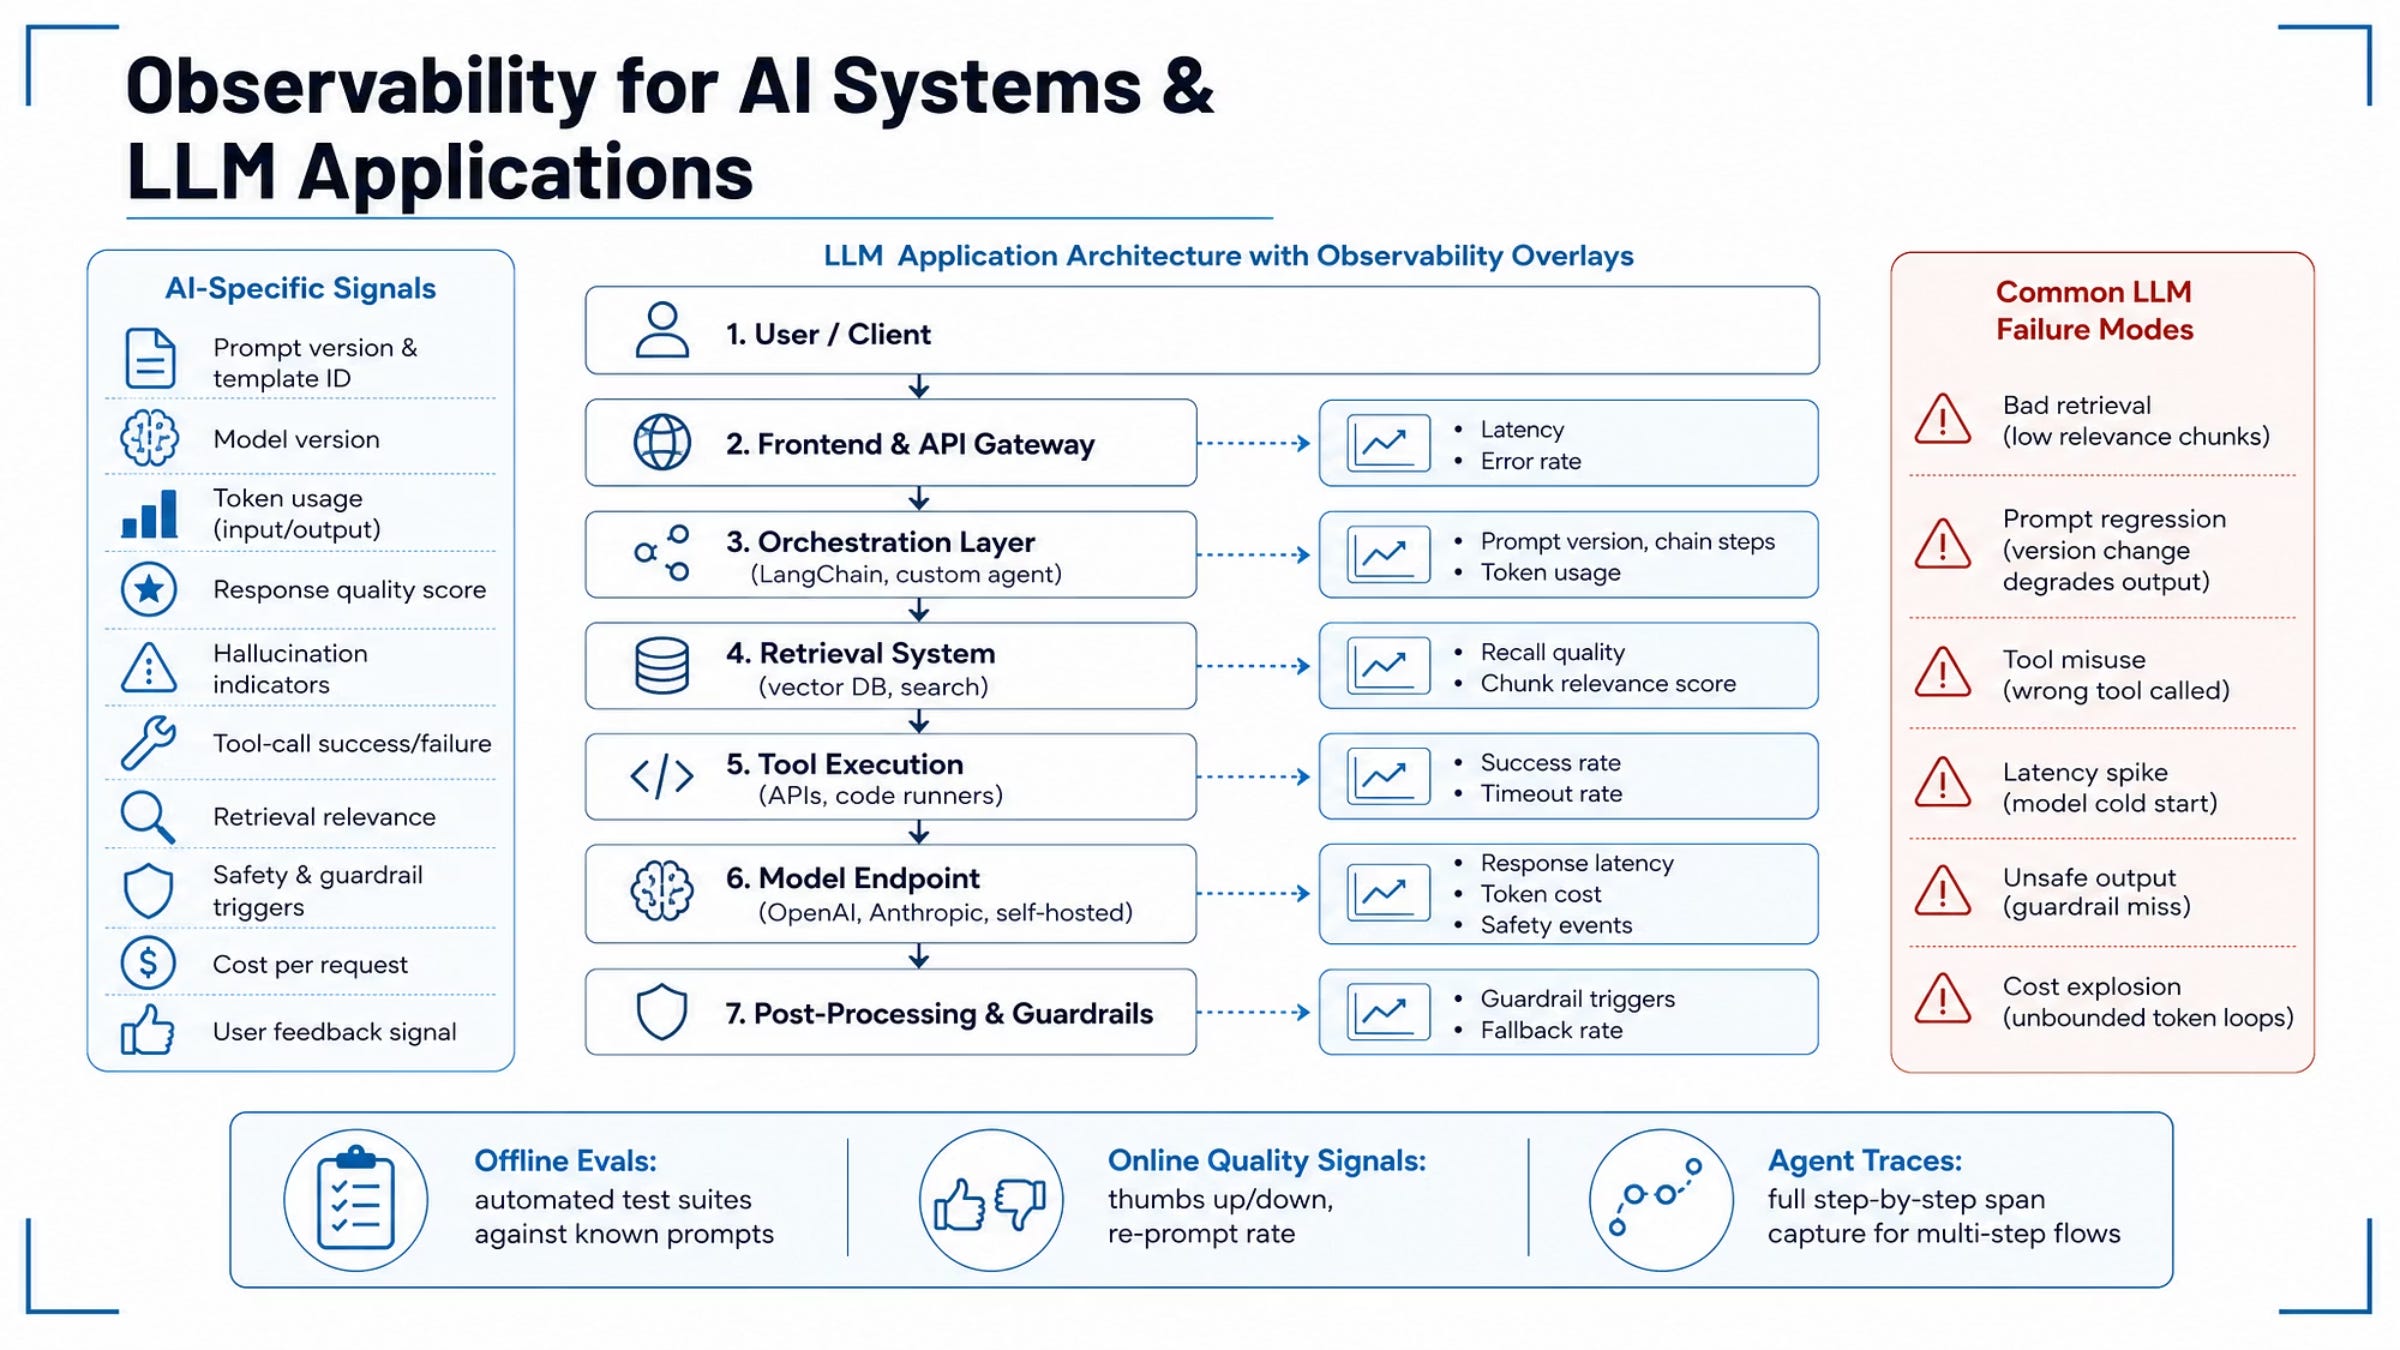
Combine offline evals, online quality signals (thumbs up/down, re-prompt rate), and full agent traces.
Bonus: Architecture & Signal Selection
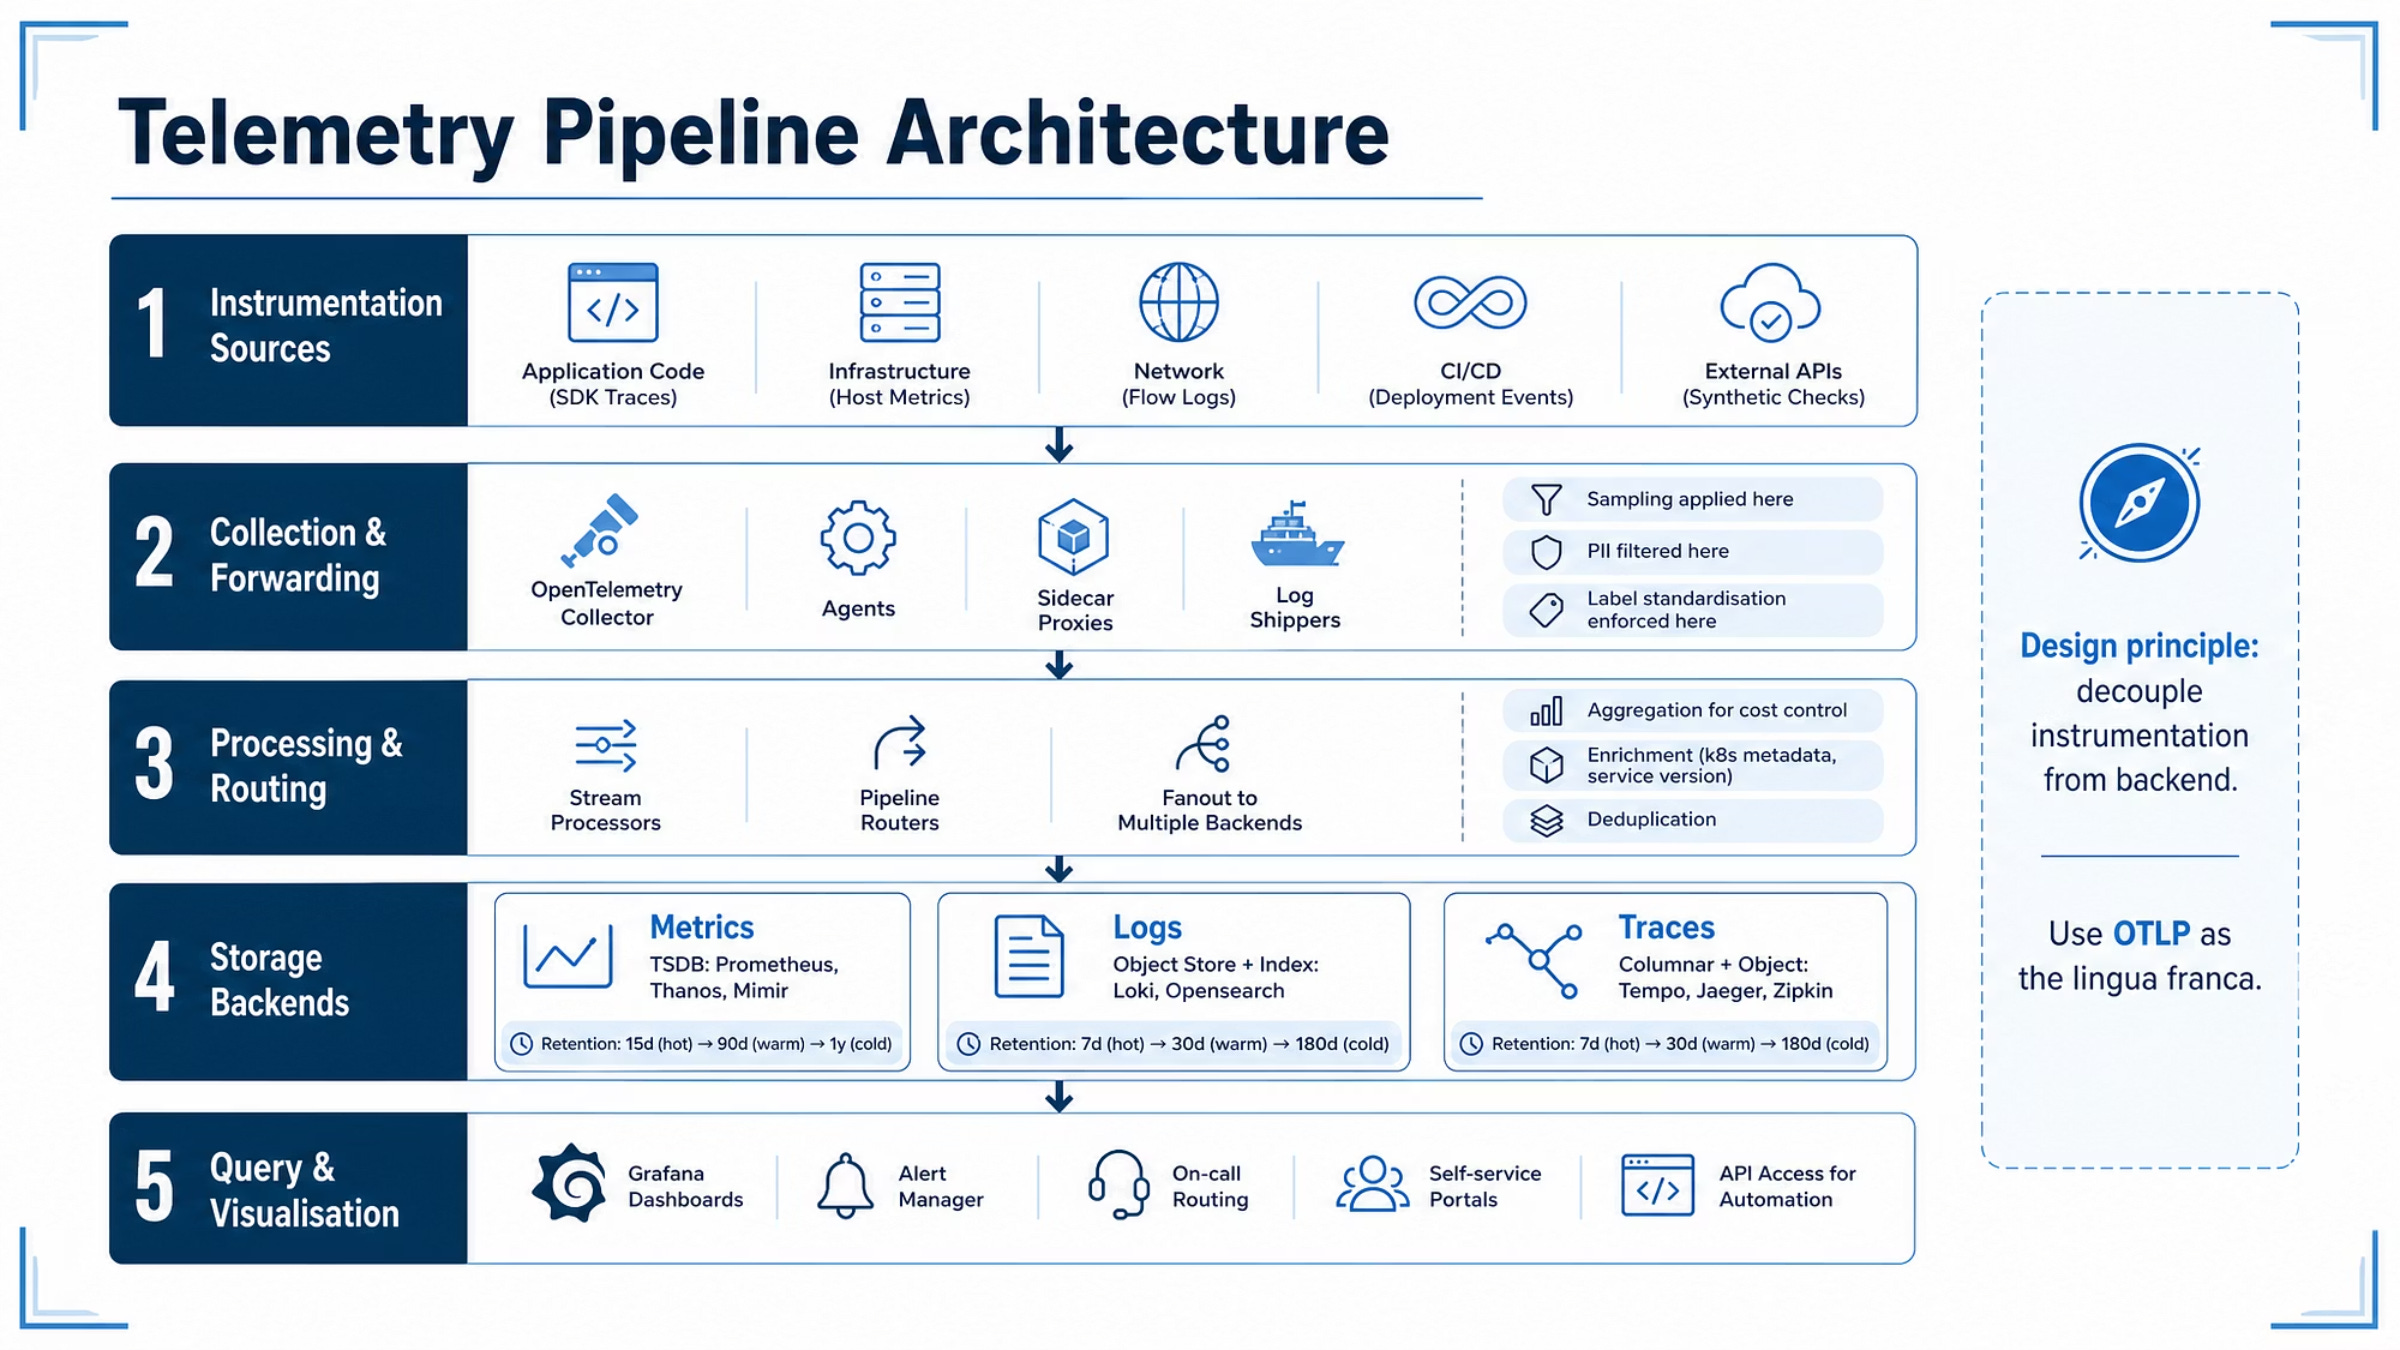
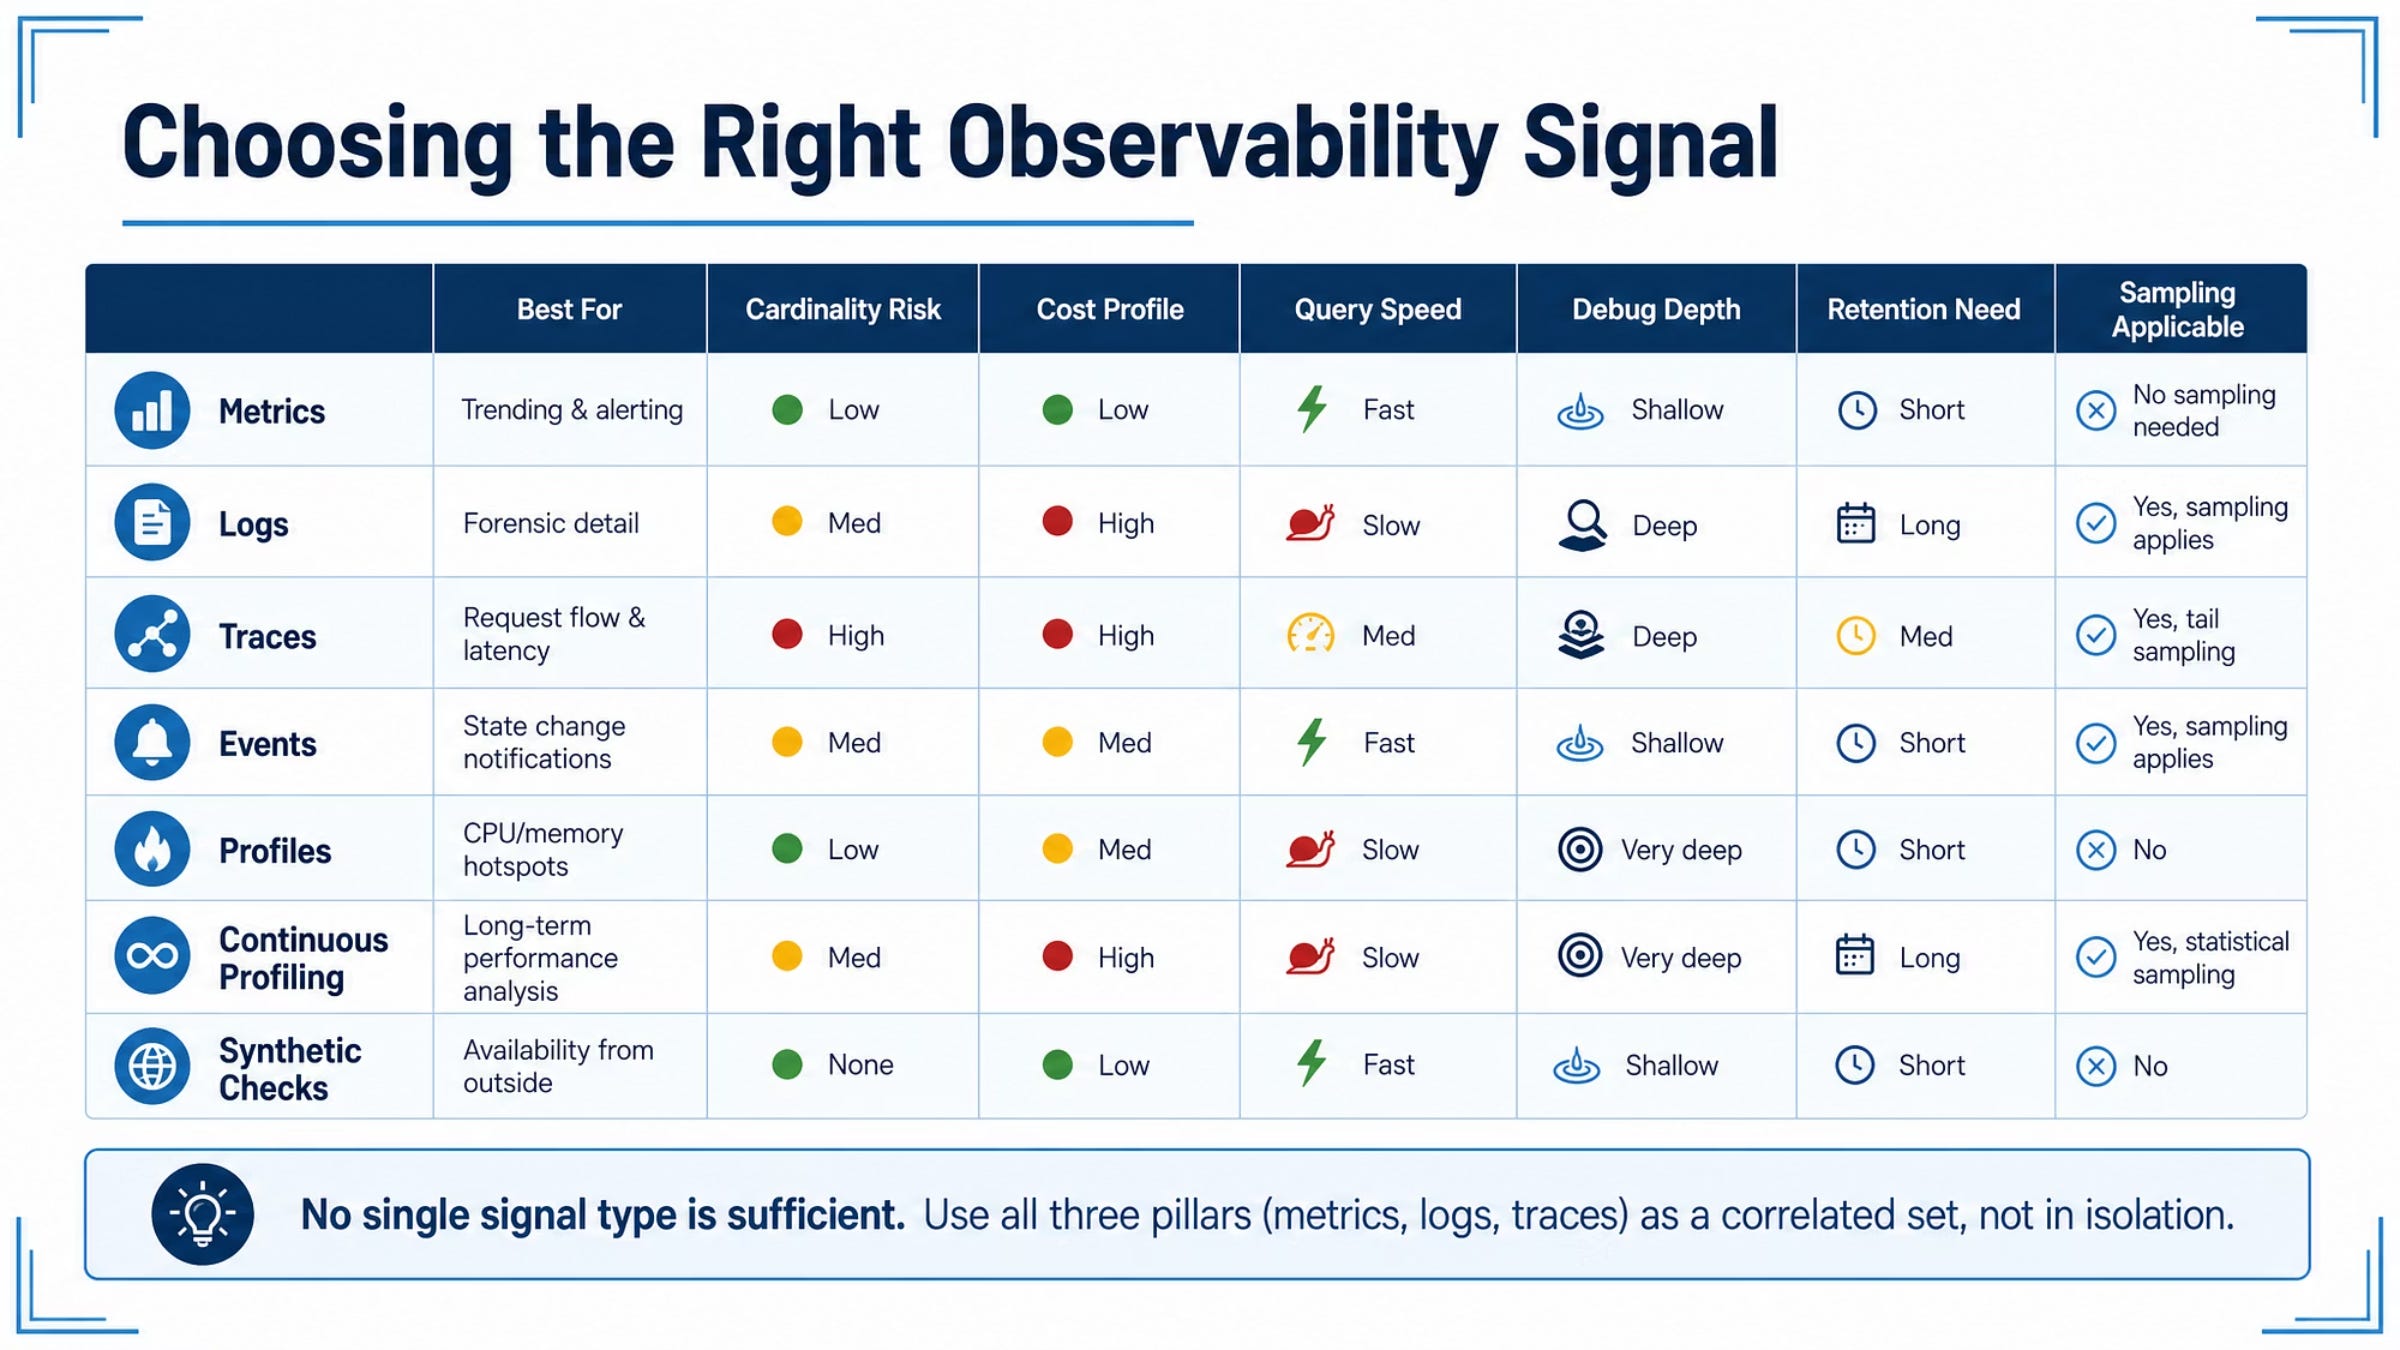
Pipeline design principle: decouple instrumentation from backend. Use OTLP as the lingua franca.
No single signal is sufficient — metrics, logs, and traces work as a correlated set.
Most teams plateau at maturity Stage 2–3. Governance and culture unlock Stage 4–5.
Key Takeaways
Define SLOs before adding dashboards
Error budgets drive release decisions
Instrument at build time, not after incidents
Control cost with sampling, tiering, and cardinality discipline
Secure pipelines — PII lives in your logs
AI assists; humans own the decisions
Observability maturity is a culture problem, not a tooling problem
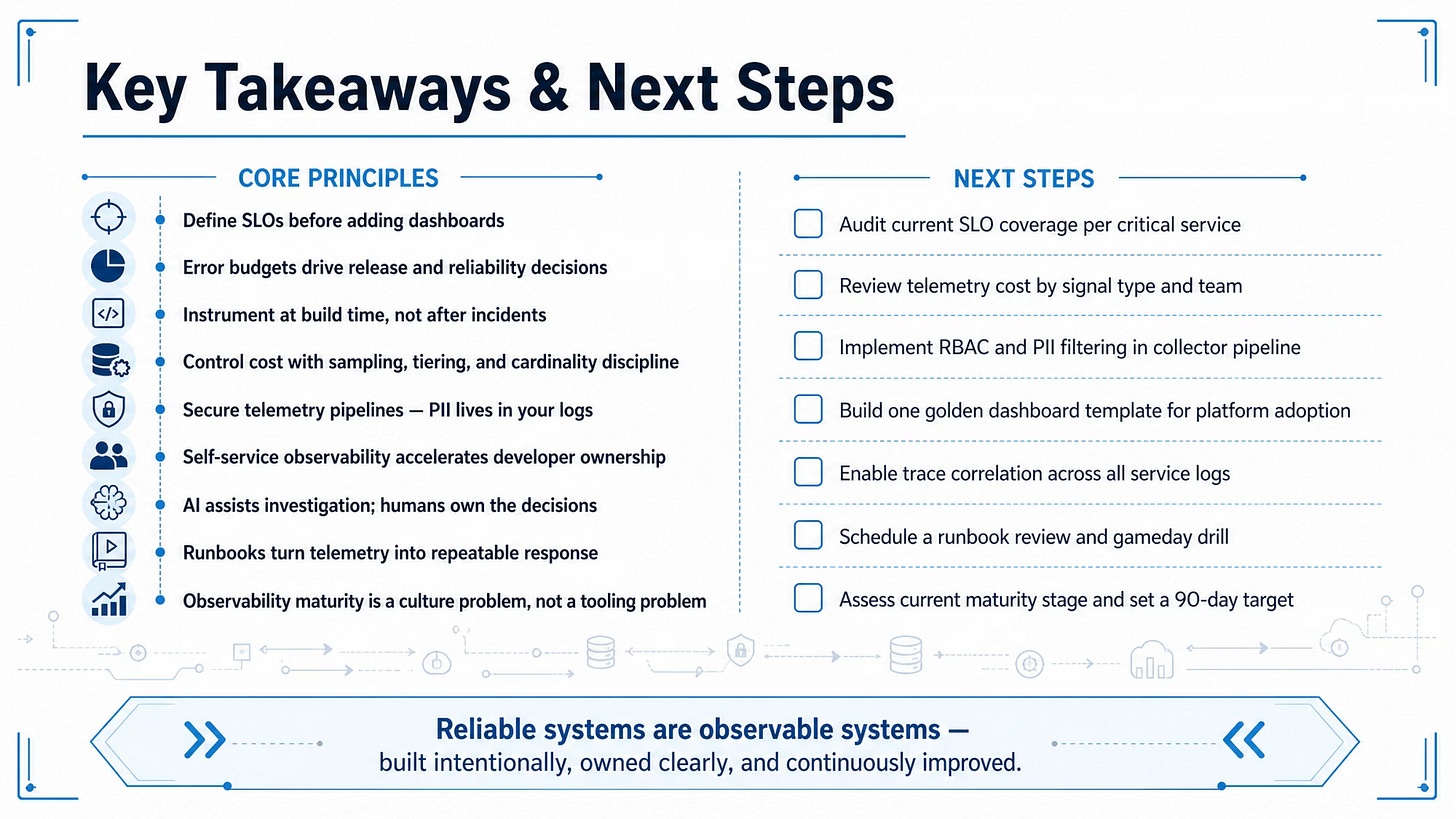
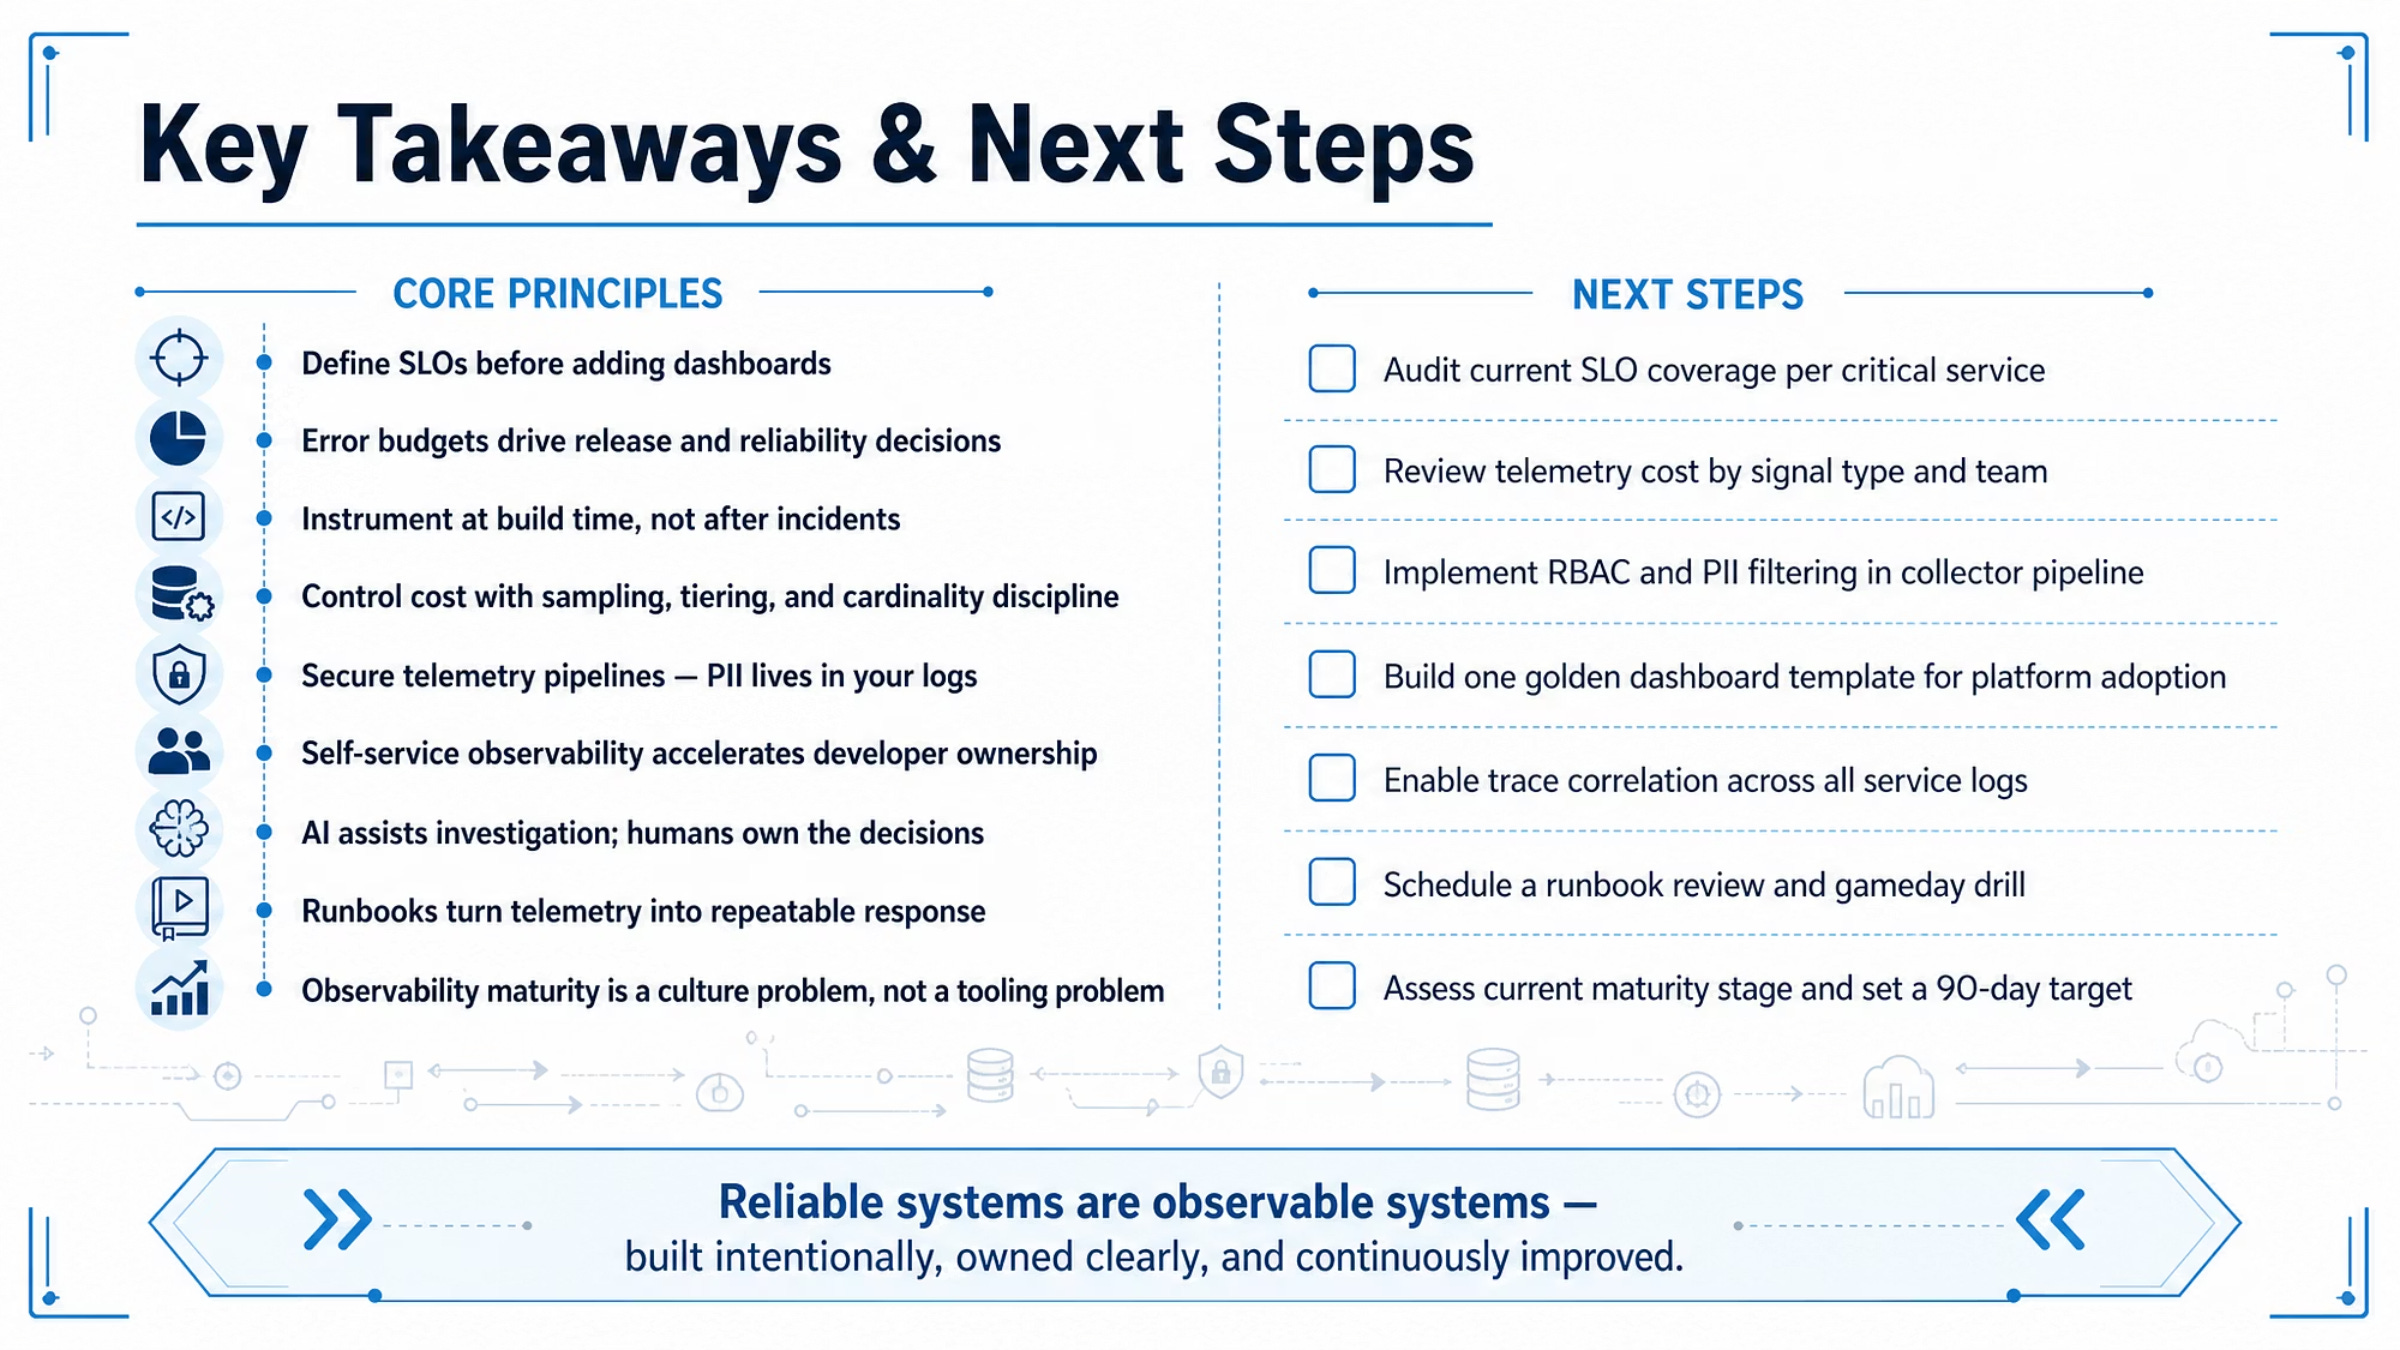
Reliable systems are observable systems - built intentionally, owned clearly, and continuously improved.
Follow Tech Fusionist ☸️
Follow me on other platforms for more DevOps, Cloud, Kubernetes, and AI content.
🔗 Linktree: https://linktr.ee/techfusionist